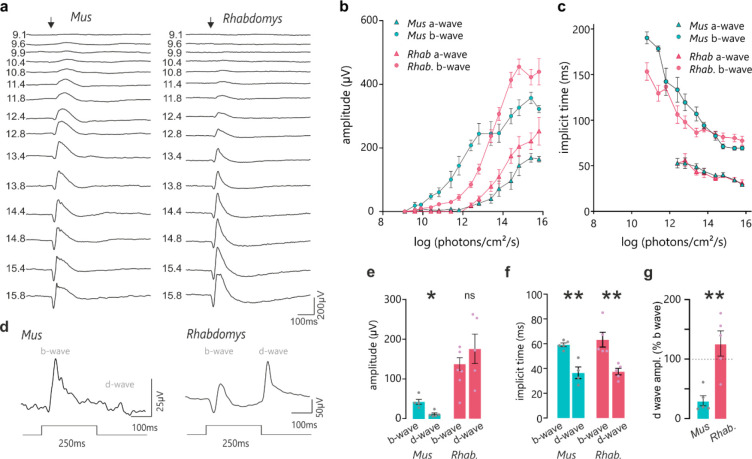
Figure 4. Retinal sensitivity to light in Mus and Rhabdomys.
a) Representative traces of dark adapted flash electroretinograms in Mus and Rhabdomys (left and right, respectively). Flash intensities range from 9.1 to 15.8 log photons/cm2/s (shown to left of ERG traces). Arrow indicates flash onset. b&c) Amplitude (b) and implicit time (c) of a and b-waves recorded in Mus (cyan) and Rhabdomys (red). Data shown mean ± SEM, n=5. d) Representative ERG traces recorded from Mus and Rhabdomys in response to 250ms light step (timecourse indicated below; light intensity 14e-log photons/cm2/s). e) Quantification of b-wave (light onset) and d-wave amplitudes (light offset) in response to 250ms light step. f) Quantification of b-wave and d-wave implicit time in response to 250ms light step. g) Quantification of b-wave and d-wave implicit times in response to 250ms light step. d-wave amplitude expressed as % of b-wave amplitude in Mus (cyan) and Rhabdomys (red). Data shown mean ± SEM, n=5.

