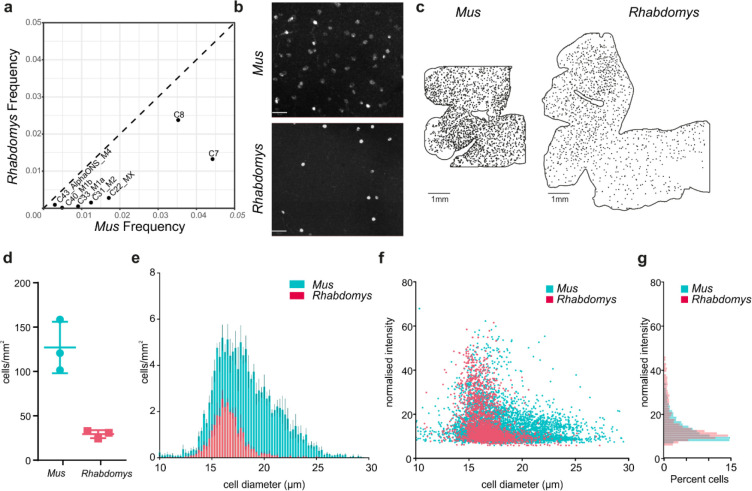
Figure 8. Quantifying ipRGCs in Rhabdomys and Mus retinae using HCR.
a) Scatterplot showing the reduced frequency of putative ipRGC types in Rhabdomys (y-axis) compared to Mus (x-axis). b) Representative HCR-FISH of Mus and Rhabdomys retinal wholemounts, with probe for Opn4 (species specific). Scale bar = 50μm. c) As in b, but showing location of Opn4 +ve RGCs across whole retina. Scale bar = 1mm. d) Number of Opn4 +ve cells/mm2 in Mus and Rhabdomys retinal wholemounts (n=3; lines show mean±SEM). e) Histogram showing diameter of Opn4 +ve cells/mm2 in Mus (cyan) and Rhabdomys (red) retinal wholemounts (n=3; data show mean±SEM). f) Scatter plot showing diameter of Opn4 +ve cells/mm2 vs normalised signal intensity in Mus (cyan) and Rhabdomys (red) retinal wholemounts (n=3). g) Histogram showing normalised intensity of Opn4 +ve cells in Mus (cyan) and Rhabdomys (red) retinal wholemounts (n=3 retinae; Kolmogorov-Smirnov test: P<0.001)

