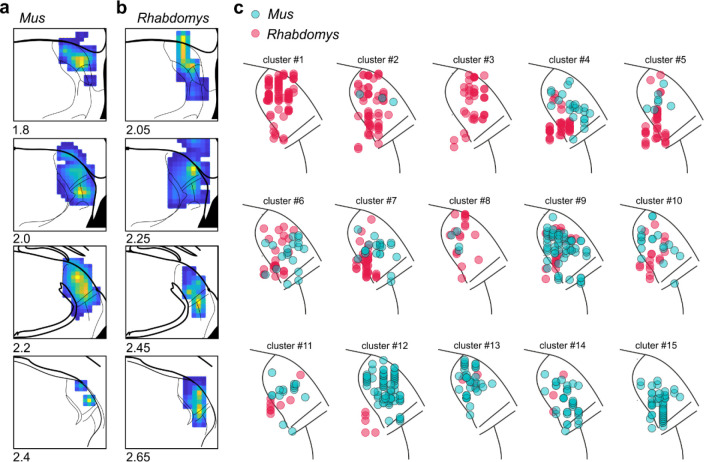
Extended data Figure 1. Location of recorded units in Mus and Rhabdomys.
a&b, Heat map showing reconstruction of light-evoked responses in Mus (a) and Rhabdomys (b). Note that histological location of dLGN is approximated in Rhabdomys from a scaled version of Mus stereotaxic atlas. Numbers below each plot indicate distance from bregma. c) Location of units assigned to each functional cluster for Mus (cyan) and Rhabdomys (red). For simplicity, location is compressed on rostro-caudal axis and superimposed onto dLGN map in coronal plane.

