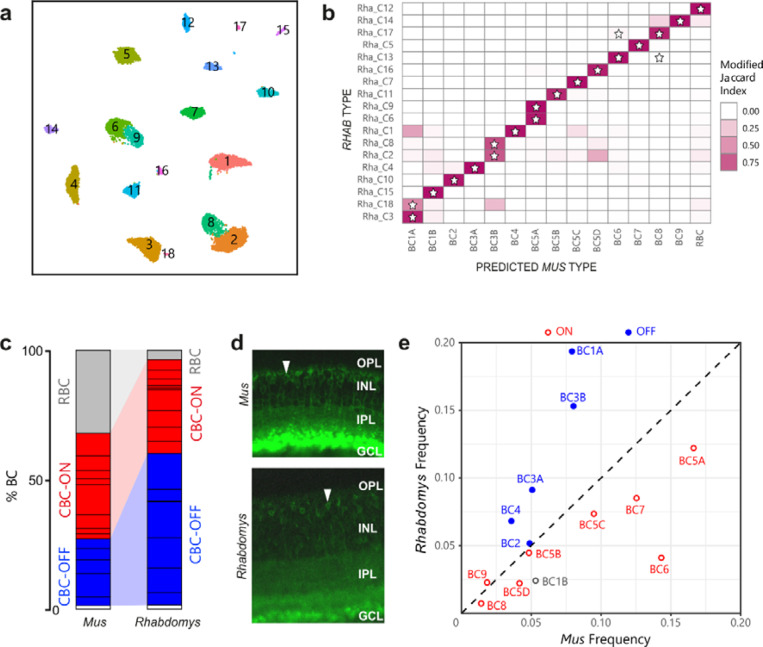
Figure 6. Proportions of bipolar cell types in Rhabdomys and Mus.
a) Rhabdomys BCs clustered separately and displayed using UMAP. Cells coloured by cluster identity b) Confusion matrix indicating the transcriptional correspondence between Rhabdomys BC cluster identity (rows) and classifier-assigned Mus BC type identity (columns). Cells are coloured based on the modified Jaccard Index (colourbar, right), which ranges from 0 (no-correspondence) to 1 (perfect correspondence; see Methods for details). Pairs of Rhabdomys clusters and Mus types that belong to the same BC “orthotype” in24 are indicated by a star. The preponderance of stars along the diagonal indicates a high concordance between the correspondence analysis presented here and the orthotype analysis in 24 c) Bar graph showing percentage of BCs assigned rod BC (grey), cone ON BC (red), cone OFF BC (blue) or BC1B (white) cell types in Mus and Rhabdomys. Dark horizontal lines within each subclass demarcate distinct types. Percentages for biological replicates are shown in Supplementary Table 1. d) Transverse sections of Mus and Rhabdomys stained with antibodies to PKCalpha. INL, Inner nuclear layer; IPL, inner plexiform layer; GCL, ganglion cell layer. RBC axon terminals are labelled intensely; arrowhead indicates an RBC cell body. e) Scatter plot comparing the relative frequency of ON (red) and OFF (blue) cone BC types (labelled according to Mus) between the two species. BC1B, which cannot be classified as either ON or OFF, is labelled grey.

