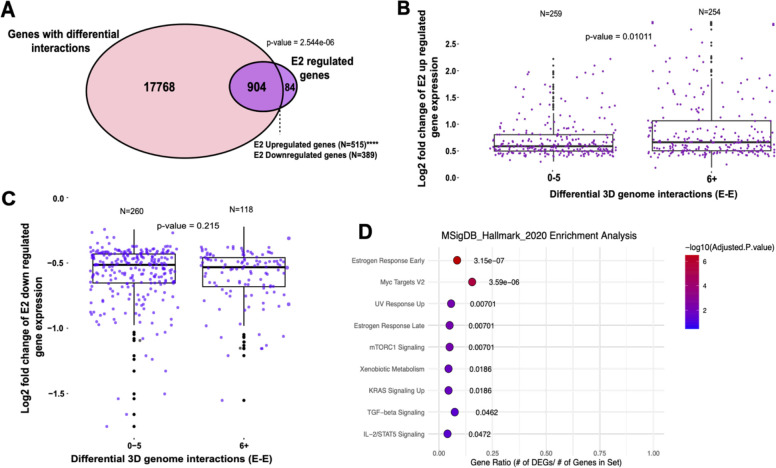
Figure 2. 3D genome structure changes upon estrogen treatment associate with differential gene expression.
A) Overlap is shown between E2 regulated genes (purple) and those involved with differential 3D interactions (pink) in Ishikawa cells; ****p < 0.00001. (B-C) Boxplots demonstrate relative expression of E2 up-regulated (B) down-regulated (C) genes associated with less than 6 differential 3D genome interactions and more than 5 differential 3D genome interactions in Ishikawa cells. D) The rank of hallmark gene sets associated with E2 regulated genes with differential 3D genome interactions in Ishikawa cells is shown.

