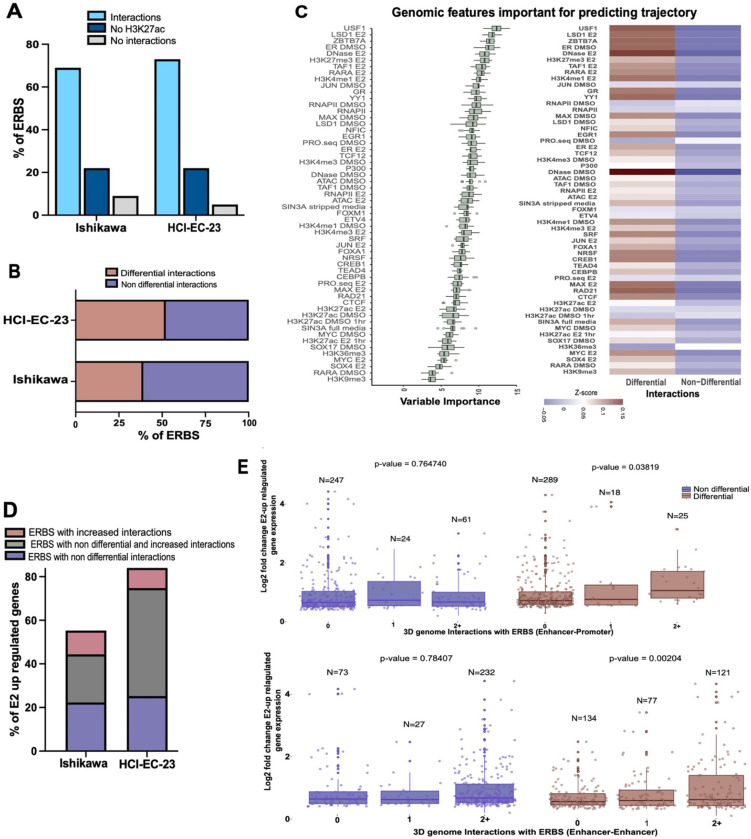
Figure 3. ERBS exhibit distinctive features when involved in differential 3D interactions.
(A-B) Bar graphs portray ERBS associated with 3D genome interactions and their classifications in endometrial cell lines. (C, left) Ranking of genomic features based on their importance for ERBS associated with differential or non-differential interactions is shown. (C, right) Heatmap displays the average signal intensity for top-ranked genomic features clustered by ERBS with differential or non-differential interactions. (D) Bar graph shows the classification of E2 up-regulated genes associated with ERBS in (non) differential interactions within 100 kb of their TSS. (E) Box plots compare fold change for E2 up-regulated genes split by the number of non-differential (left, blue) or differential (right, brown) enhancer-promoter (top) or enhancer-enhancer (bottom) loops involving ERBS.

