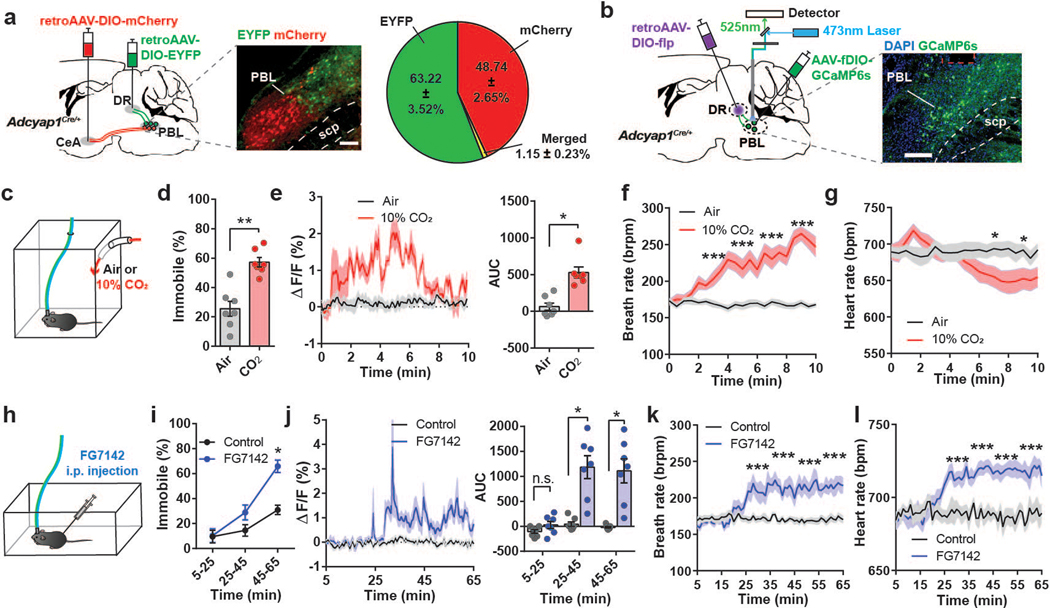
Fig. 1. Activity of PACAPPBL→DR neurons increases in panicogenic conditions.
a, Schematic and representative image of Cre-dependent retrograde expression of mCherry in PACAPPBL neurons projecting to the CeA, and EYFP expression in DR-projecting PACAPPBL neurons. Percentages of indicated fluorescent cells in the PBL are represented via a pie chart. Scale bar: 100 µm. Injections were repeated in 3 mice with similar results. b, Schematic and representative images of Cre- and Flp-dependent expression of GCaMP6s, as well as the implantation of fiber in the PBL of an Adcyap1Cre/+ mouse to monitor PACAPPBL→DR neuronal activity via fiber photometry. Scale bar: 100 µm. This experiment was repeated on seven mice with similar results. c, Schematic of the CO2 exposure test. d, Immobile behavior during 10 min of normal air (control condition) or 10% CO2 exposure. Paired two-sided t-test, P < 0.001. n = 7 mice. e, Change in calcium activity during 10 min of air or 10% CO2 exposure and corresponding AUC analysis. Paired two-sided t-test, P = 0.0039. n = 7 mice. f, g, Breathing (f, repeated measure two-way ANOVA with Sidak’s multiple comparisons test), and heart rate (g, mixed-effects analysis with Sidak’s multiple comparisons test) changes during CO2 exposure. n = 14 mice. Respiration responses to both air and CO2 exposure were taken from the same mice. Lines represent mean responses during each condition in the same mice. h, Schematic of FG-7142 (20 mg/kg) i.p. injection. i, Immobile behavior change following FG-7142 injection. Repeated measure two-way ANOVA with Sidak’s multiple comparisons test. n = 7 mice. Time = 0 is when FG-7142 was injected and recordings started 5 mins after the injection. j, Change in calcium activity following i.p. injection of FG-7142, and corresponding AUC analysis within each 20-min bin. Repeated measure two-way ANOVA with Sidak’s multiple comparisons test. n = 7 mice. k, l, Breathing (k, repeated measure two-way ANOVA with Sidak’s multiple comparisons test), and heart rate (l, repeated measure two-way ANOVA with Sidak’s multiple comparisons test) changes 30 min after FG-7142 injection. n = 9 mice. Data are presented as the mean ± SEM; see also Supplementary Table 3 for statistical details. *P<0.05, **P<0.01, ***P<0.001.

