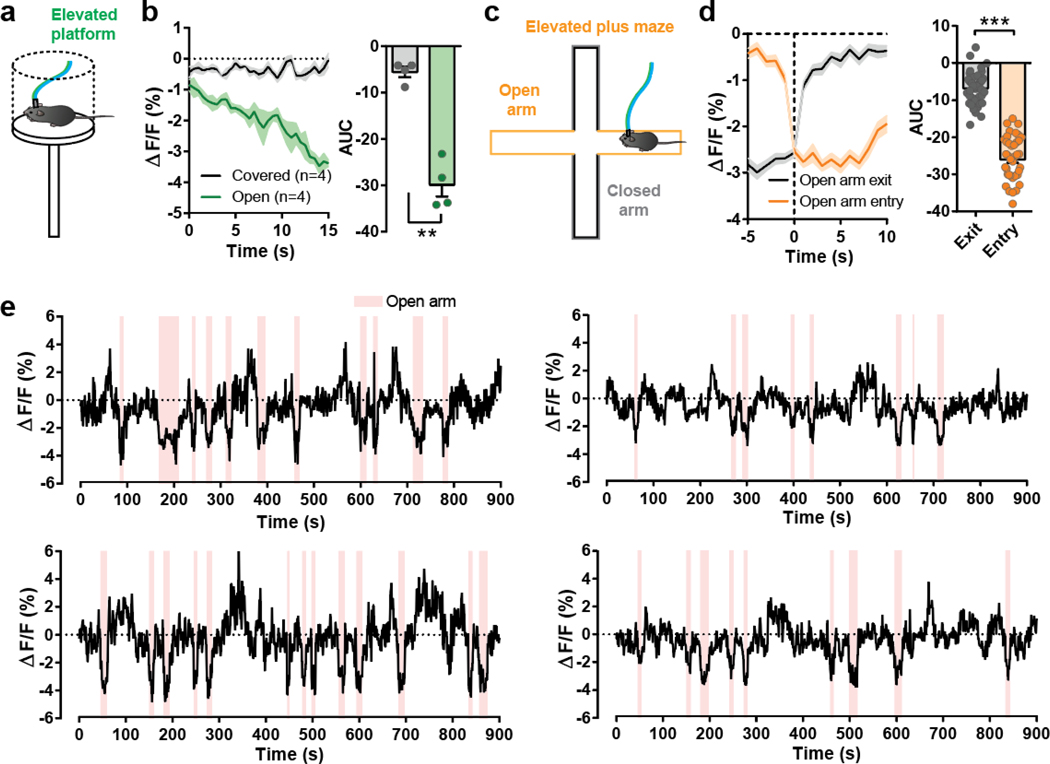
Extended Data 4. Calcium activity changes in PACAPPBL→DR neurons during anxiogenic conditions.
a, Schematic of the elevated platform test. b, Average calcium trace during elevated platform assessment, and corresponding area under curve (AUC) analysis. Paired two-sided t-test, P = 0.0017. n = 4 mice. c, Schematic of the elevated plus maze. d, Average calcium trace during the seconds immediately preceding and following open arm entry and exit, with corresponding AUC analysis. Paired two-sided t-test, P < 0.0001. n = 4 mice. e, Calcium traces from individual animals. Pink shading indicates when mice were in the open arm. n = 4 mice. Data are presented as the mean ± SEM; see also Supplementary Table 3 for statistical details. **P<0.01, ***P<0.001.

