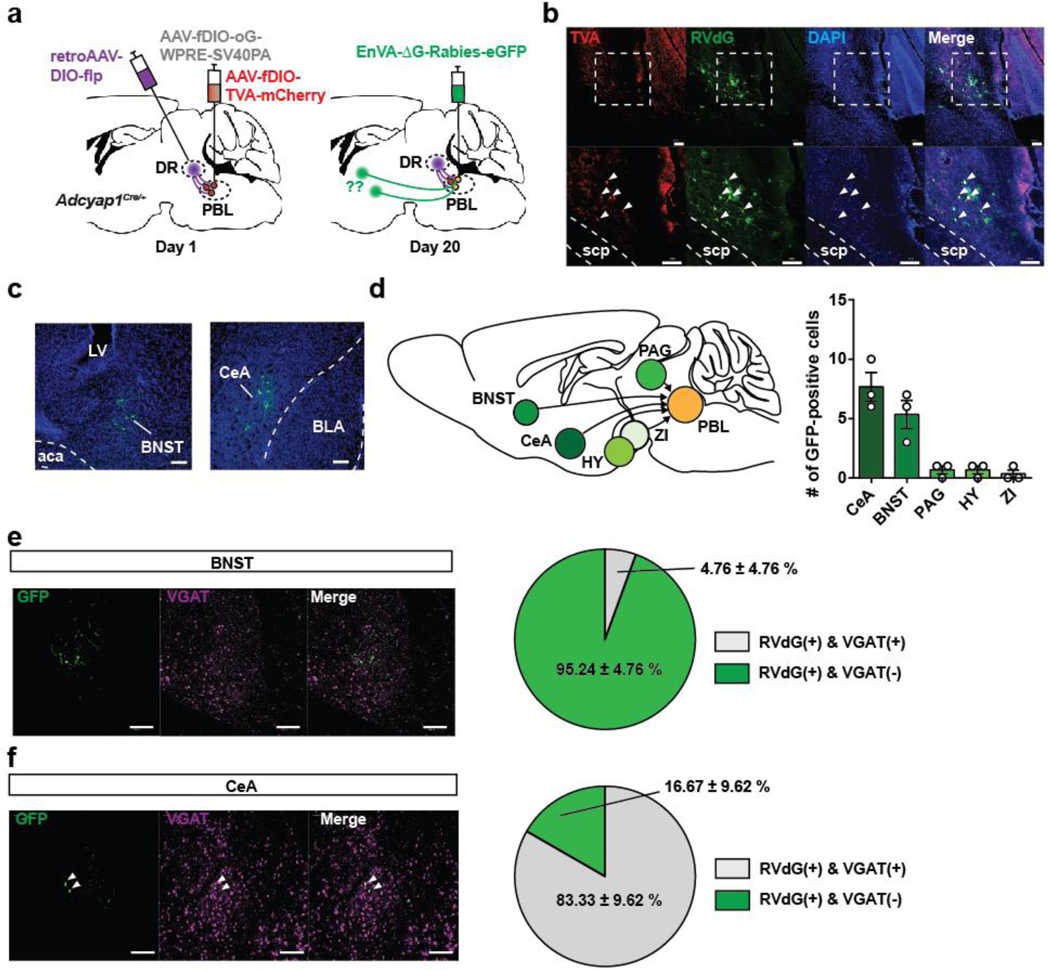
Extended Data 5. Inputs to PACAPPBL→DR neurons.
a, Schematics of Cre- and Flp-dependent retrograde tracing in PBL of an Adcyap1Cre/+ mouse for identification of inputs to PACAPPBL→DR neurons. b, Histology of TVA and RVdG expression in PBL. Scale bars: 50 µm. Injections were repeated on three mice with similar results. c, Representative images of cTRIO tracing in BNST and CeA. Scale bars: 50 µm. Injections were repeated on three mice with similar results. d, Schematic of inputs to PACAPPBL→DR neurons. Repeated measure one-way ANOVA with Sidak’s multiple comparisons test, F (4, 8) = 21.871, P = 0.0073. n = 3 mice. e,f, Histological images of RVdG and VGAT expression, and graphical representation of the percentage of VGAT colocalization in BNST (e) and CeA (f). Scale bars: 50 µm. n = 3 mice. Data are presented as the mean ± SEM; see also Supplementary Table 3 for counting and statistical details.

