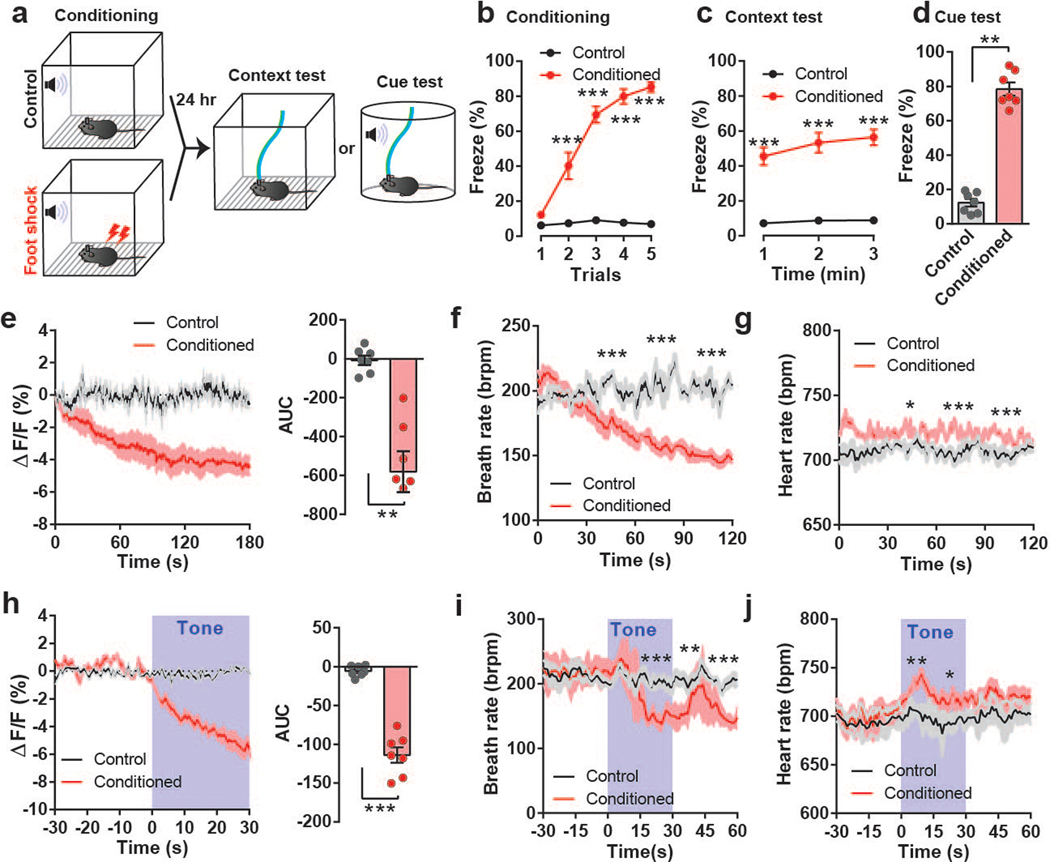
Fig. 2. Activity of PACAPPBL→DR neurons decreases during retrieval in the fear conditioning test.
a, Schematic of the fear conditioning experiment. b–d, Freezing behavior during conditioning (b, repeated measure two-way ANOVA with Sidak’s multiple comparisons test), context (c, repeated measure two-way ANOVA with Sidak’s multiple comparisons test), and cue tests (d, paired two-sided t-test, P < 0.001). n = 7 mice. e, PACAPPBL→DR calcium activity change during context test and corresponding AUC analysis. Paired two-sided t-test, P = 0.0017. n = 4 mice. f,g, Breathing (f, repeated measure two-way ANOVA with Sidak’s multiple comparisons test), and heart rate (g, mixed-effects analysis with Sidak’s multiple comparisons test) changes during the context test. n = 6 (control), n = 5 mice (conditioned). h, Calcium activity change during cue test and corresponding AUC during tone presentation. Paired two-sided t-test, P < 0.001. n = 7 mice. Tone presentation is denoted by blue shading. i,j, Breathing (i, repeated measure two-way ANOVA with Sidak’s multiple comparisons test), and heart rate (j, repeated measure two-way ANOVA with Sidak’s multiple comparisons test) changes during the cue test. n = 6 control mice, n = 5 conditioned mice. Data are presented as the mean ± SEM; see also Supplementary Table 3 for statistical details. *P<0.05, **P<0.01, ***P<0.001.

