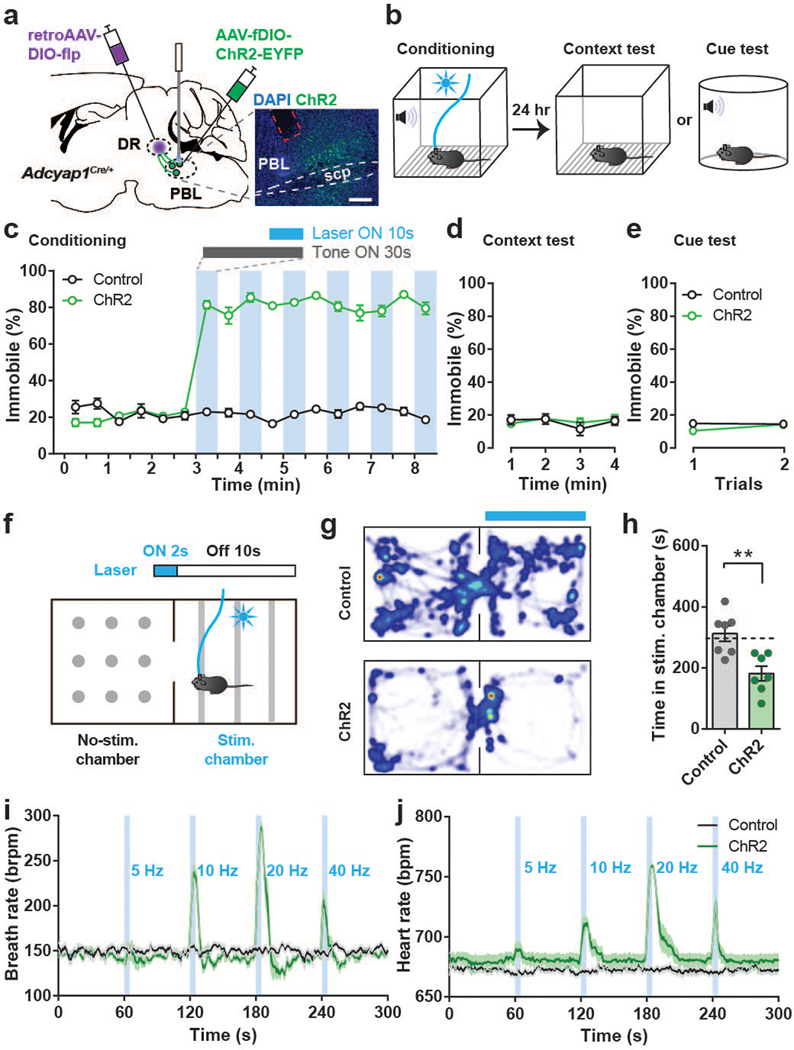
Fig. 3. Activation of PACAPPBL→DR neurons produces panic-like symptoms without forming associative memory.
a, Schematic and histological confirmation of Cre- and Flp-dependent expression of ChR2 in the PBL of an Adcyap1Cre/+ mouse for optogenetic activation of PACAPPBL→DR neurons. Scale bars: 100 µm. This experiment was repeated on seven mice with similar results. b, Schematic of the optical conditioning test. c–e Immobility levels during conditioning (c), context (d), and cue assessments (e). n = 7 mice per group. Laser activation is denoted by blue shading. f, Schematic of the real-time place aversion test. g,h, Representative heat maps of mouse activity (g), and average time spent in the stimulation-paired and non-paired chambers (h, unpaired two-sided t-test, P = 0.003). n = 7 mice per group. i,j, Breathing (i) and heart rate (j) changes were induced by PACAPPBL→DR neuronal activation in a frequency-dependent manner. n = 7 mice per group. Data are presented as the mean ± SEM; see also Supplementary Table 3 for statistical details. **P<0.01.

