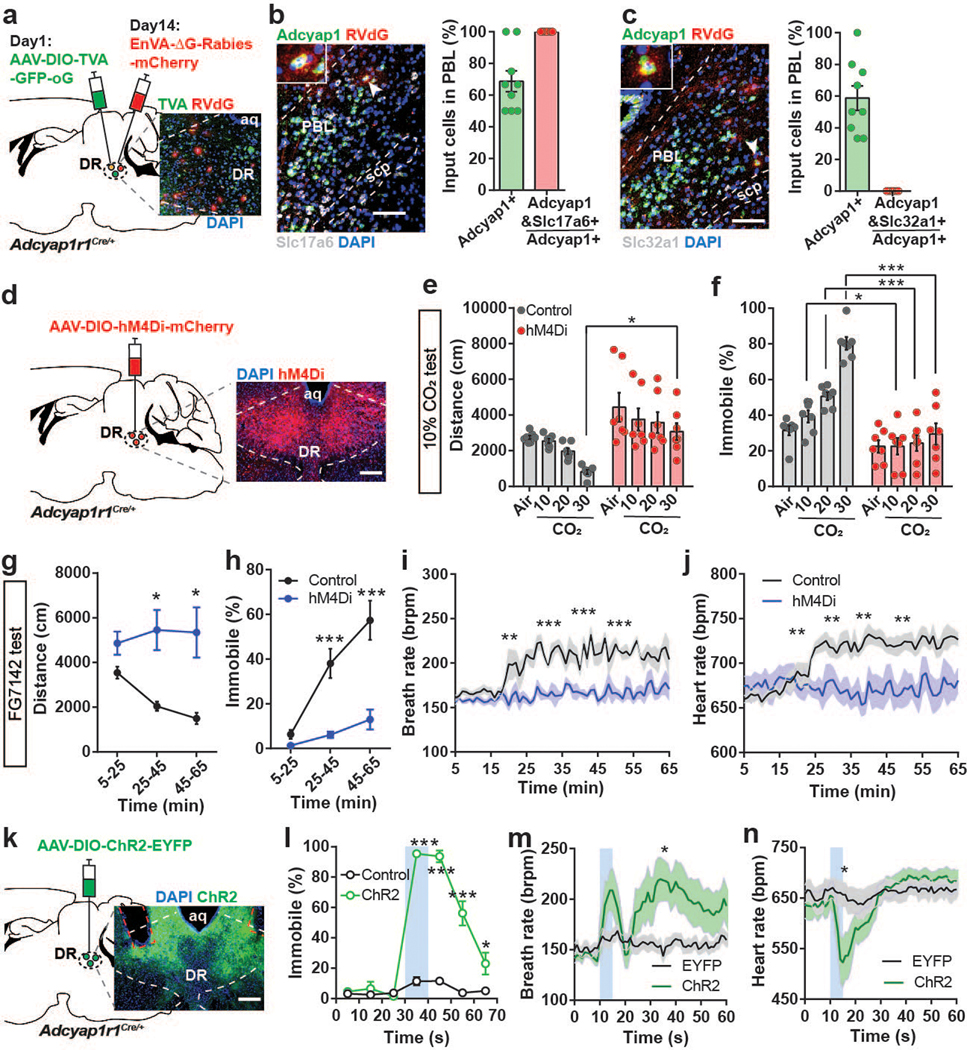
Fig. 6. PAC1RDR neurons receive monosynaptic input from PACAPPBL neurons, and their activation is necessary and sufficient for induction of panic-like symptoms.
a, Schematic and histological confirmation of retrograde rabies tracing of PAC1RDR neurons. b, Histological image of RVdG, PACAP (Adcyap1), and VGluT2 mRNA (Slc17a6) in the PBL (left), with statistical analysis of the presynaptic inputs in PBL (right). The white arrowhead indicates an example of a presynaptic PACAPPBL neuron colocalized with VGluT2. n = 9 slices, 3 mice. c, Histological image of RVdG, PACAP mRNA (Adcyap1), and VGAT mRNA (Slc32a1) in the PBL (left), with statistical analysis of the presynaptic inputs in PBL (right). The white arrowhead indicates an example of a presynaptic PACAPPBL neuron. n = 9 slices, 3 mice. d, Schematic and histological confirmation of Cre-dependent expression of hM4Di in the DR of an Adcyap1r1Cre/+ mouse for chemogenetic inhibition of PAC1RDR neurons. e–f Distance traveled (e, mixed-effects analysis with Sidak’s multiple comparisons test), and immobile behavior (f, repeated measure two-way ANOVA with Sidak’s multiple comparisons test) before (air) and after CO2 exposure during chemogenetic inhibition of PAC1RDR neurons. n = 7 mice per group. g,h, Distance traveled (g, mixed-effects analysis with Sidak’s multiple comparisons test), and immobility behavior (h, repeated measure two-way ANOVA with Sidak’s multiple comparisons test) after FG-7142 injection during chemogenetic inhibition of PAC1RDR neurons. n = 7 mice per group. i,j, Breathing (i, repeated measure two-way ANOVA with Sidak’s multiple comparisons test), and heart rate (j, repeated measure two-way ANOVA with Sidak’s multiple comparisons test) change after FG-7142 injection during chemogenetic inhibition of PAC1RDR neurons. n = 7 mice per group. k, Schematic and histological confirmation of Cre-dependent expression of ChR2 and optic fiber placement in the DR of an Adcyap1r1Cre/+ mouse for optogenetic activation of PAC1RDR neurons. l, Photostimulation (10 sec, 40 Hz) induced immediate immobile behavior. Repeated measure two-way ANOVA with Sidak’s multiple comparisons test. n = 6 trials/6 EYFP mice, n = 10 trials/5 ChR2 mice. Laser activation is indicated by blue shading. m,n, Breathing (m, mixed-effects analysis with Sidak’s multiple comparisons test), and heart rate (n, mixed-effects analysis with Sidak’s multiple comparisons test) changes following photoactivation of PAC1RDR neurons (5 sec, 40 Hz). n = 10 trials/5 mice per group. All scale bars: 100 µm. Data are presented as the mean ± SEM; see also Supplementary Table 1, 3 for counting and statistical details. *P<0.05, **P<0.01, ***P<0.001.

