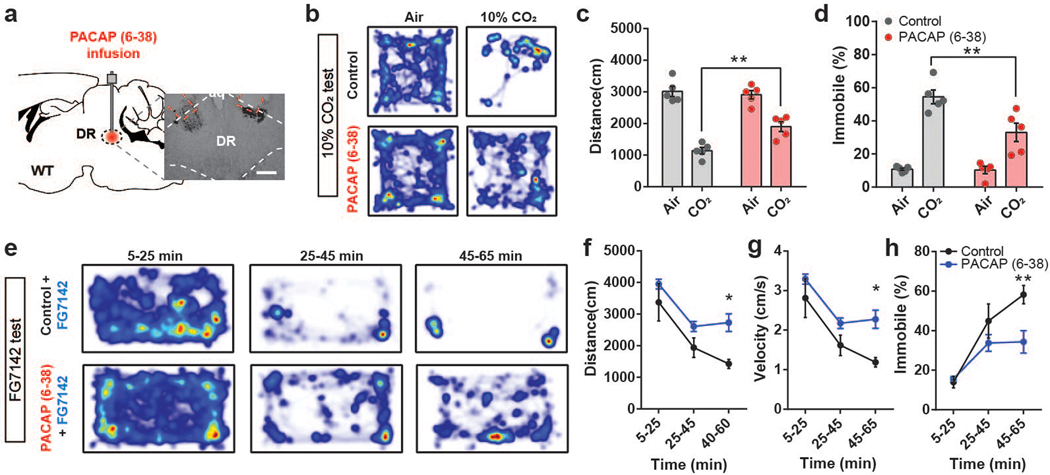
Fig. 7. Infusion of PAC1R antagonist PACAP (6–38) into DR attenuates panic-like symptoms.
a, Schematic and histological confirmation of cannula implantation into the DR of WT mouse for infusion of PAC1R antagonist PACAP (6–38). Scale bars: 100 µm. This experiment was repeated on five mice with similar results. b–d Heat map of mouse activity (b), distance traveled (c, repeated measure two-way ANOVA with Sidak’s multiple comparisons test), and immobility behavior (d, repeated measure two-way ANOVA with Sidak’s multiple comparisons test) before (air) and after CO2 exposure following PACAP (6–38) infusion. n = 5 mice per group. e–h Representative heat maps of mouse activity (e), distance traveled (f, repeated measure two-way ANOVA with Sidak’s multiple comparisons test), velocity (g, repeated measure two-way ANOVA with Sidak’s multiple comparisons test), and immobility behavior (h, repeated measure two-way ANOVA with Sidak’s multiple comparisons test) after FG-7142 injection and PACAP (6–38) infusion. n = 5 mice per group. Data are presented as the mean ± SEM; see also Supplementary Table 3 for statistical details. *P<0.05, **P<0.01.

