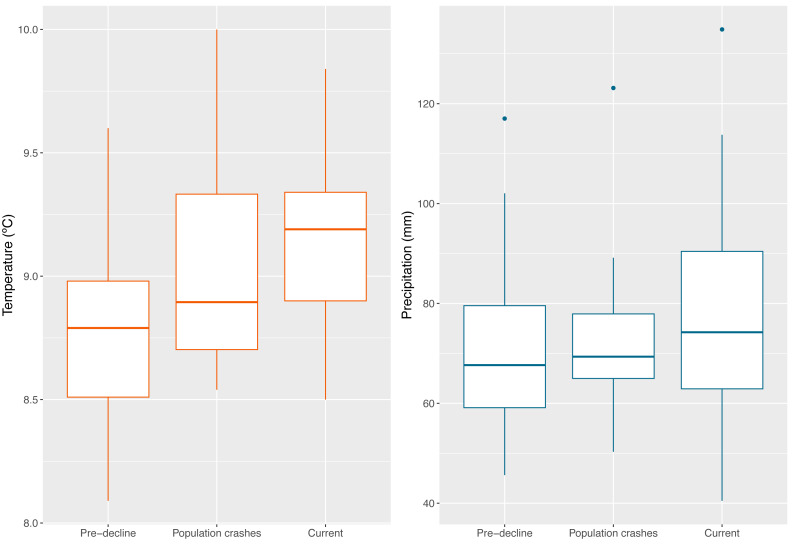
Figure 12. Boxplot showing the climatic conditions of all Jambato’s localities (historical and present) during the analyzed timeframes (Pre-decline 1960–1980, Population crashes 1981–1990, Current 1991–2021).
(A) Average annual temperature. (B) Mean annual precipitation. Image prepared by Mateo A. Vega-Yánez.

