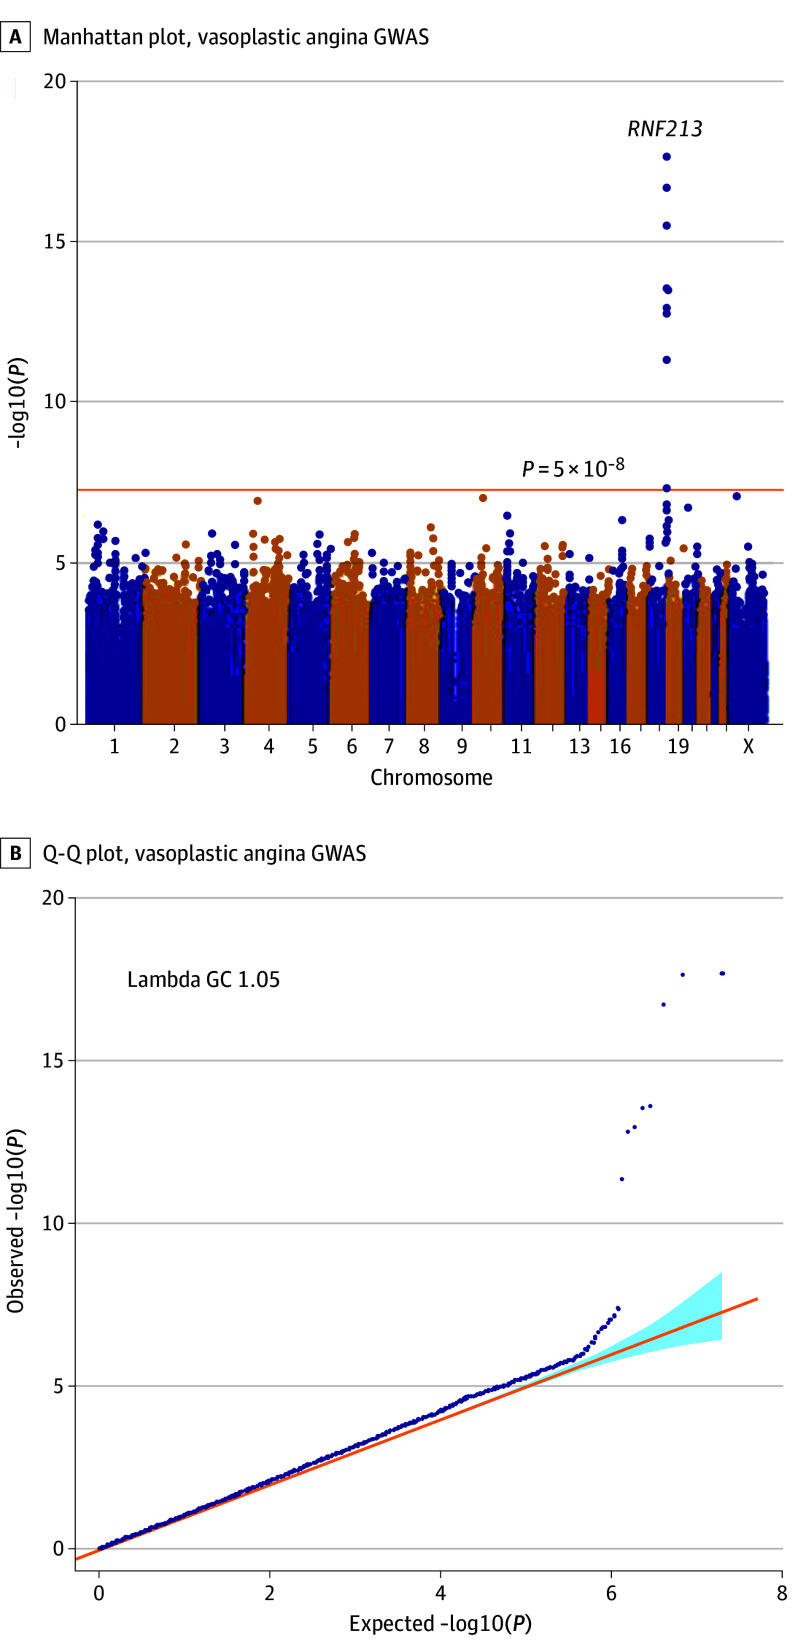
Figure 1. Manhattan and Quintile-Quintile (Q-Q) Plot for Vasospastic Angina Genome-Wide Association Study (GWAS).
GWAS results for the combined dataset. Genetic association tests adjusted for sex and principal components 1 to 10. A, Manhattan plot. B, Q-Q plot. The orange line represents the genome-wide significance level (P = 5 × 10⁻⁸). Gene names are shown next to the top loci.

