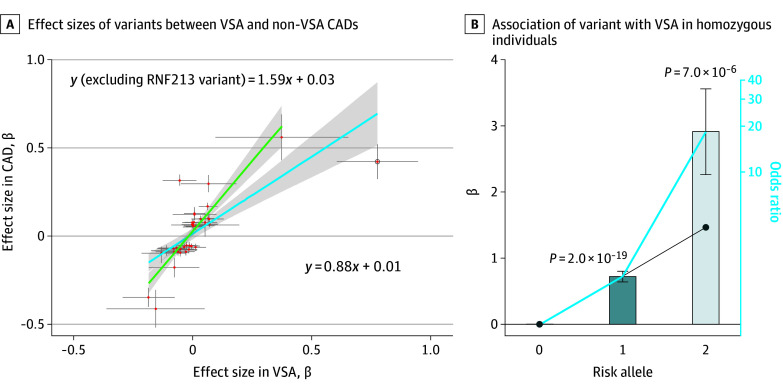
Figure 2. Characteristic Associations of RNF213 With Vasospastic Angina (VSA).
Association analyses results for the combined dataset. A, Comparison of effect sizes of coronary artery disease (CAD)–associated variants between VSA and non-VSA CADs. The bars crossing the red dots represent the 95% CIs of the β coefficients. The dot with a circle is the variants at the RNF213 locus. The blue line depicts the regression line, with its 95% CI shaded in gray, that includes the RNF213 variant. The green line represents the regression line, with its 95% CI shaded in gray, without the RNF213 variant. B, Pronounced association of rs112735431 with VSA in homozygous individuals deviating from the additive model. The effect sizes of rs112735431 on VSA were compared between patients heterozygous and homozygous for the risk allele. Patients homozygous for the nonrisk allele of rs112735431 were used as references. The x-axis shows the number of risk alleles of rs112735431, and the y-axis shows the β coefficients of rs112735431. The bars crossing the black dots in the bar graph represent the SEs of the β coefficients. The diagonal black line represents the assumption of a linear relationship of the effect sizes (based on the β coefficient in heterozygotes). The blue solid line represents the observed increase in the effect sizes in the present study.

