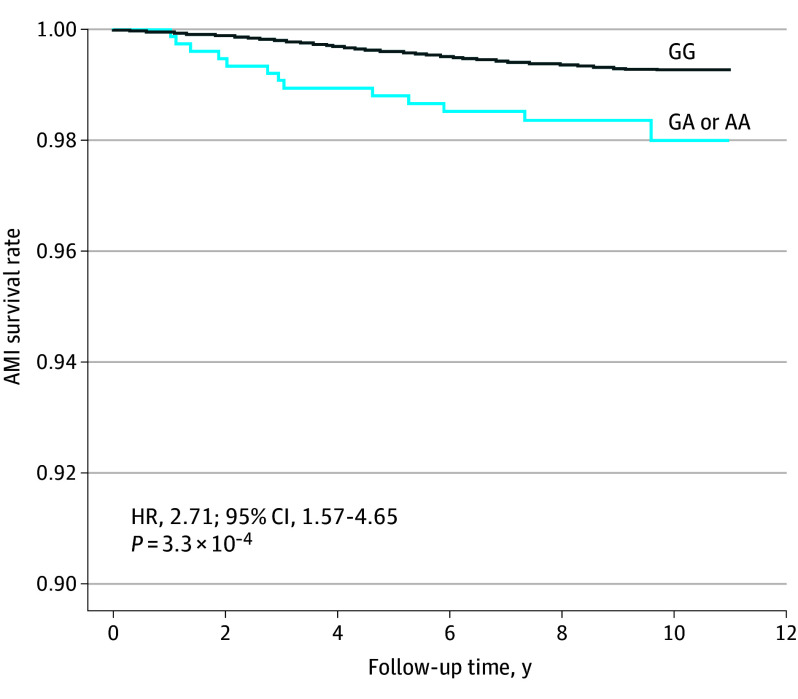
Figure 4. High Mortality Rate of Acute Myocardial Infarction (AMI) in Individuals Carrying rs112735431.
Kaplan-Meier survival curve for patients with and without risk alleles of rs112735431 who die due to AMI registered at the Biobank Japan Project, excluding those registered for cancers and cardiac diseases. The x-axis represents the follow-up years of the patients, and the y-axis represents survival rates for AMI. The solid curve represents outcomes in patients without the risk allele (A) of the variant in the VSA. The blue curve represents those without the risk alleles. AA indicates homozygous individuals; GA, heterozygous individuals; GG, wild-type individuals; HR, hazard ratio; VSA, vasospastic angina.

