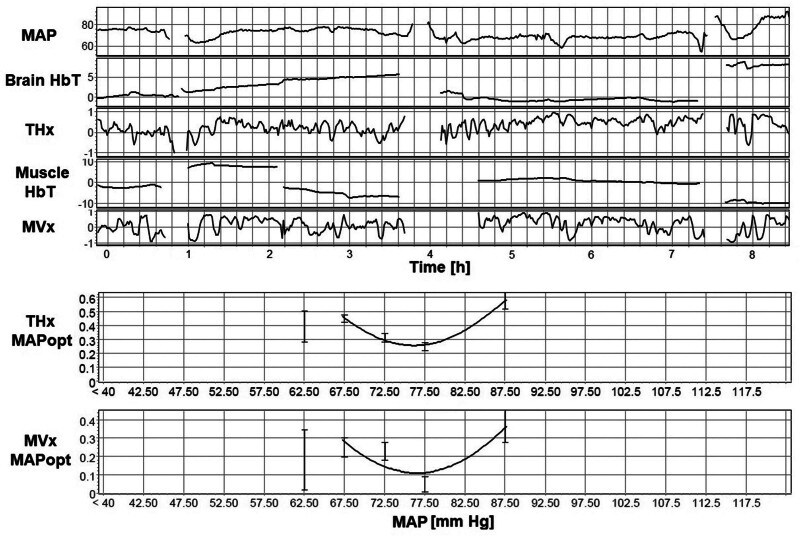
Figure 2.
Derivation of optimal mean arterial pressure (MAPopt) from a representative time series from a single patient. Near-infrared spectroscopy signals from brain total hemoglobin (HbT) (THx) and muscle HbT (MVx), with the removal of motion artifacts and 10-s moving average filter, are used to derive a correlation index with arterial blood pressure denoted as THx and MVx, respectively. The error bar charts of THx and MVx vs. mean arterial pressure (MAP) bins are used to fit a U-shaped curve that calculates the nadir as MAPopt; this is the MAP with best preservation of microvascular autoregulation. In this particular patient, the fitted MAPopt curves derived from the brain and muscle exhibit a high degree of similarity, despite differences in the correlation indices for each MAP bin between the two organs.

