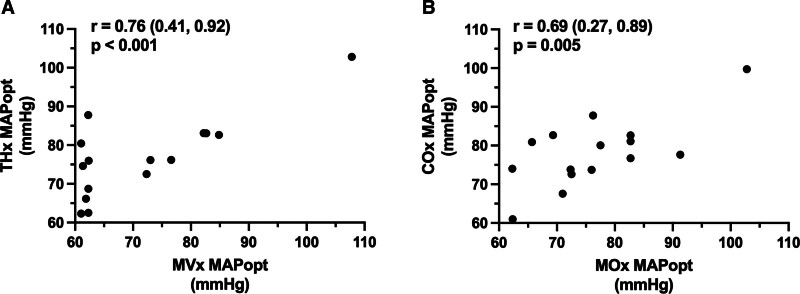
Figure 4.
Correlation between optimal mean arterial pressure (MAPopt) values obtained from muscle and brain near-infrared spectroscopy (NIRS) for each patient in the cohort, derived from correlation indices from NIRS total hemoglobin (muscle total hemoglobin [MVx], brain total hemoglobin [THx]) and tissue saturation index (muscle tissue saturation index [MOx], brain tissue saturation index [COx]). A, Correlation between MVx–MAPopt and THx–MAPopt. B, Correlation between MOx–MAPopt and COx–MAPopt. Values represent Pearson correlation coefficient (95% CI).

