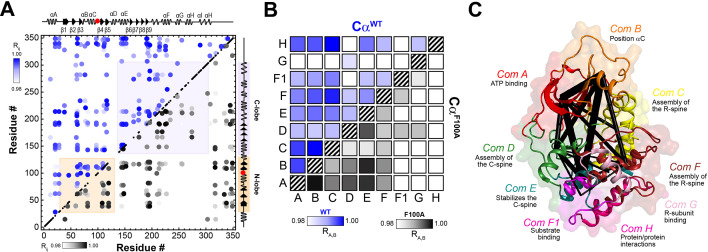
Figure 10. Correlated chemical shift changes reveal the uncoupling of the intramolecular allosteric network in PKA-CF100A.
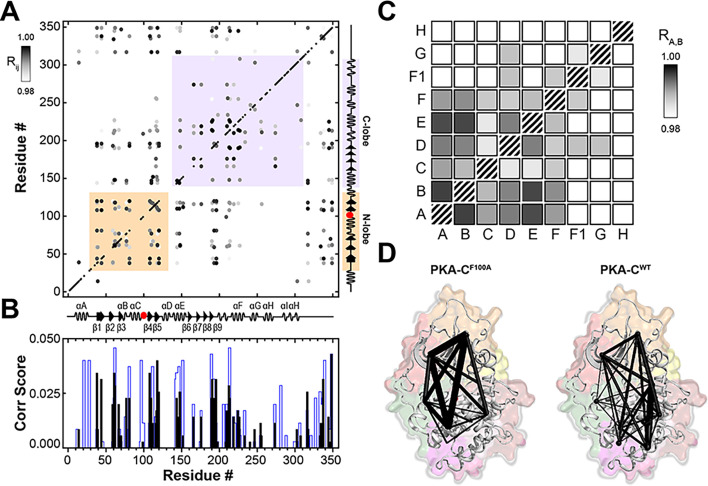
(A) Comparison of the CHEmical Shift Covariance Analysis (CHESCA) matrices obtained from the analysis of the amide CS of PKA-CWT (blue correlations) and PKA-CF100A (black correlations). The correlations coefficients (Rij) were calculated using the apo, ADP-, ATPγN-, and ATPγN/PKI5-24-bound states. For clarity, only correlation with Rij > 0.98 are displayed. For the enlarged CHESCA map of F100A see Figure 10—figure supplement 1. The data for the PKA-CWT matrix were taken from Walker et al., 2019. (B) Community CHESCA analysis of PKA-CWT (blue correlations) and PKA-CF100A (black correlations). Only correlations with RA,B > 0.98 are shown. (C) Spider plot showing the extent of intramolecular correlations identified by the community CHESCA analysis for PKA-CF100A mapped onto the crystal structure (PDB: 4WB5). The thickness of each line in the spider plot indicates the extent of coupling between the communities.


