. 2024 Jun 24;12:RP91506. doi: 10.7554/eLife.91506

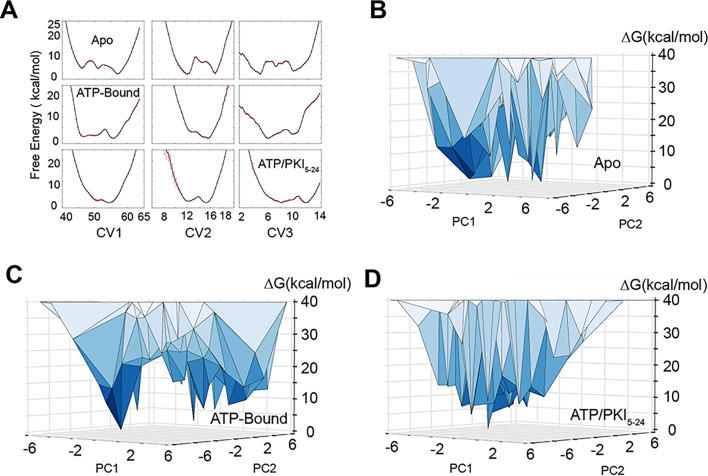
Figure 2. Free energy landscape of PKA-C obtained from replica-averaged metadynamics (RAM) simulations.

(A) Convergence of the bias deposition along the first three collective variables (CVs). The free energy (expressed in kcal/mol) of the different CVs was averaged over the last 100 ns of RAM simulations. The standard deviations are reported as red error bars. (B–D) Free energy landscape along the first two principal components (PC1 and PC2) of PKA-C in the apo, ATP-, and ATP/PKI-bound forms. PC1 and PC2 are projected from the first three CVs. The vertices represent conformational states. In the apo form, multiple states have comparable free energy with ΔG < 5 kcal/mol, whereas in the binary form, fewer states have ΔG < 5 kcal/mol. For the ternary form only a major ground state is populated.

Figure 2—source data 1. ΔG (kcal/mol) and relative population of the ground state and the first six excited states in different forms of PKA-C obtained from the replica-averaged metadynamics (RAM) simulations.

Figure 2.

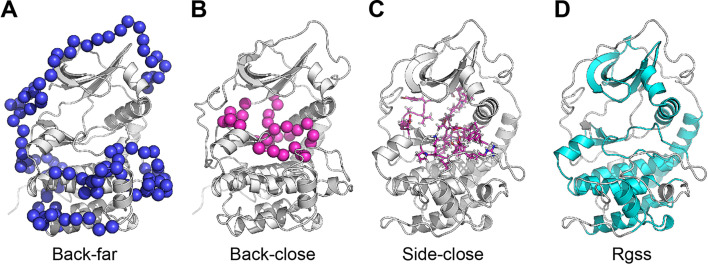
Figure 2—figure supplement 1. Illustration of the collective variables (CVs) used in the replica-averaged metadynamics (RAM) simulations.

Figure 2—figure supplement 1.

(A) Backbone ψ angles of loops not in contact with ATP (Back-far). The Cα atoms are depicted as blue spheres. (B) Backbone ψ angles of loops in contact with ATP (Back-close). The Cα atoms are colored in magenta. (C) Side chains χ1 angles of loops in contact with ATP (Side-close). The side chains are represented in sticks colored in magenta. (D) The radius of gyration is calculated over the rigid part of the protein (Rgss), where the residues involved are colored in cyan.
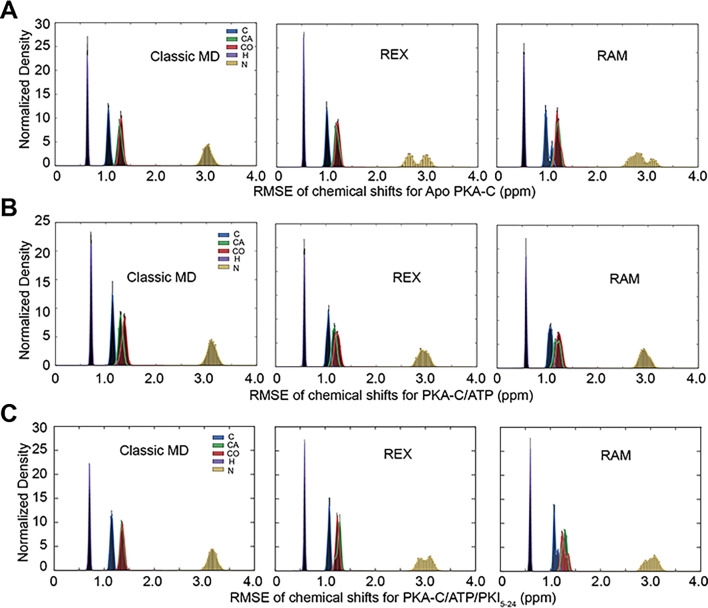
Figure 2—figure supplement 2. Distribution of the root-mean-square-error (RMSE) of the chemical shifts (CSs) for the different simulation schemes.

Figure 2—figure supplement 2.

(A) RMSE of CS for apo PKA-C calculated from standard MD (left), replica exchange (REX; middle), and replica-averaged metadynamics (RAM) (right). (B) RMSE of CS for PKA-C/ATP calculated from standard MD (left), REX (middle), and RAM (right). (C) RMSE of CS for PKA-C/ATP/PKI5-24 from standard MD (left), REX (middle), and RAM (right). Color codes for different backbone atoms (C, Cα, CO, H, and N) are indicated in the left figures.
Figure 2—figure supplement 3. Replica-averaged metadynamics (RAM) simulations explore a larger conformational space than standard MD and replica exchange (REX) simulations.
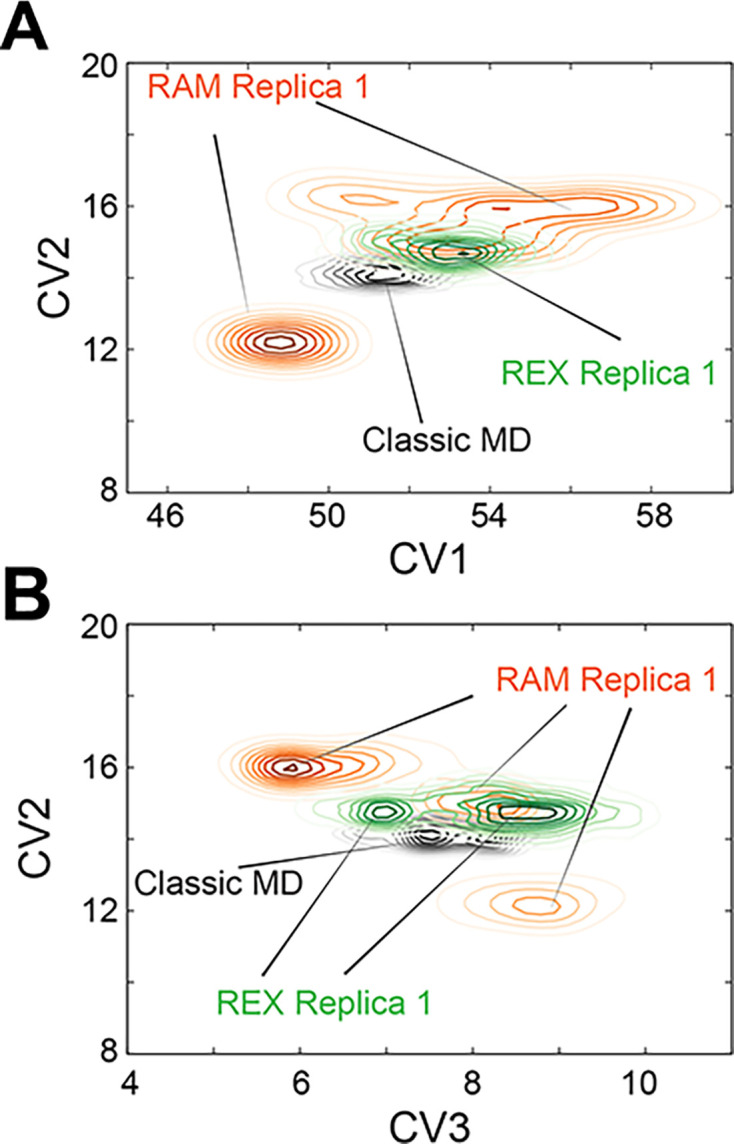
Figure 2—figure supplement 3.

(A) Comparison of conformational space (CV1 vs. CV2) sampled by RAM Replica 1, standard MD, and REX Replica 1 for PKA-C. (B) Comparison of conformational space (CV3 vs. CV2) sampled by RAM Replica 1, standard MD, and REX Replica 1 for apo PKA-C.
Figure 2—figure supplement 4. Accumulative deposition of history-dependent biases along the first three collective variables (CVs) for the replica-averaged metadynamics (RAM) simulations of the apo PKA-C.

Figure 2—figure supplement 4.

The accumulative biases converged after ~300 ns in the three CVs.