. 2024 Jun 24;12:RP91506. doi: 10.7554/eLife.91506

Figure 3. Free energy surfaces and dynamic transitions determined by a Markov State Model (MSM) for apo, ATP-, and ATP/PKI-bound PKA-C.

(A) Free energy landscape projected along the first two time-lagged independent components (tICs) of apo PKA-C, featuring three basins, ground state (GS), ES1, and ES2. The transition from GS to ES1 (arrow) highlights the changes around the αB-αC loop, with the disruption of the K72–E91 salt bridge and the PIF pocket (V80–I85–F347) hydrophobic interactions. The GS to ES2 transition (arrow) displays the rearrangement of the hydrophobic packing around the αC-β4 loop. (B, C) Free energy surfaces projected along the first two tICs for the ATP- and ATP/PKI-bound PKA-C, respectively. Known crystal structures for the three forms are indicated by small white triangles.

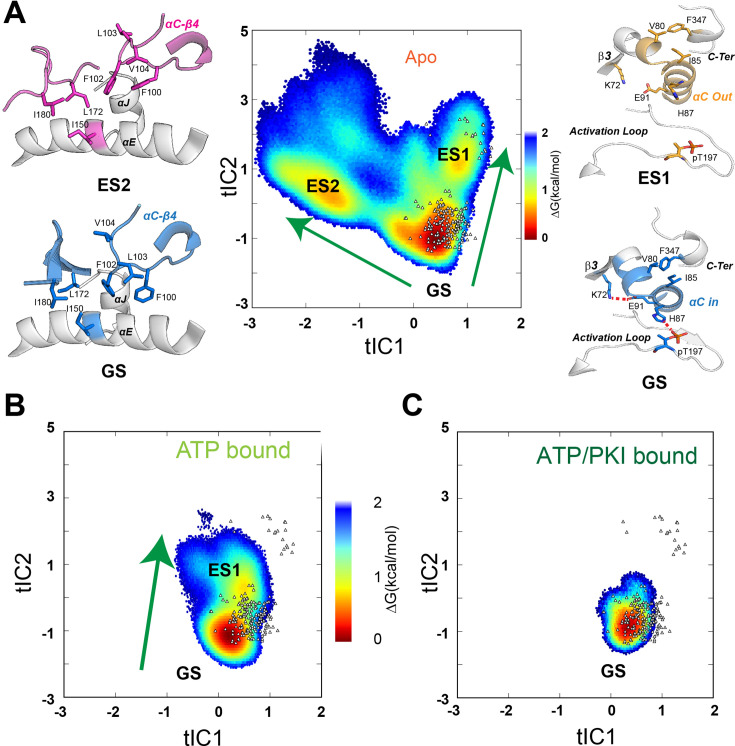
Figure 3.

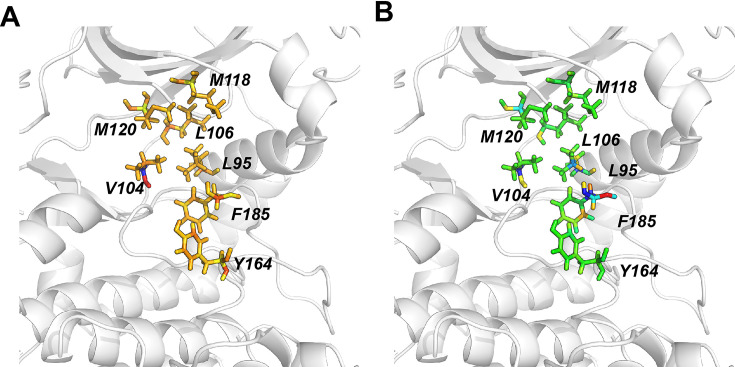
Figure 3—figure supplement 1. R spine and shell residues selected for two time-lagged independent components (tICA) and Markov State Model (MSM) analysis.

Figure 3—figure supplement 1.

(A) Atom motions of key residues that define tIC1 of apo PKA-C colored according to the superposition deviations. Backbone atoms of Val104 show the largest change in tIC1. (B) Atom motions of key residues that define tIC2 of apo PKA-C colored according to the superposition deviations. Backbone atoms of Phe185 and Val104 show the largest change in tIC2.
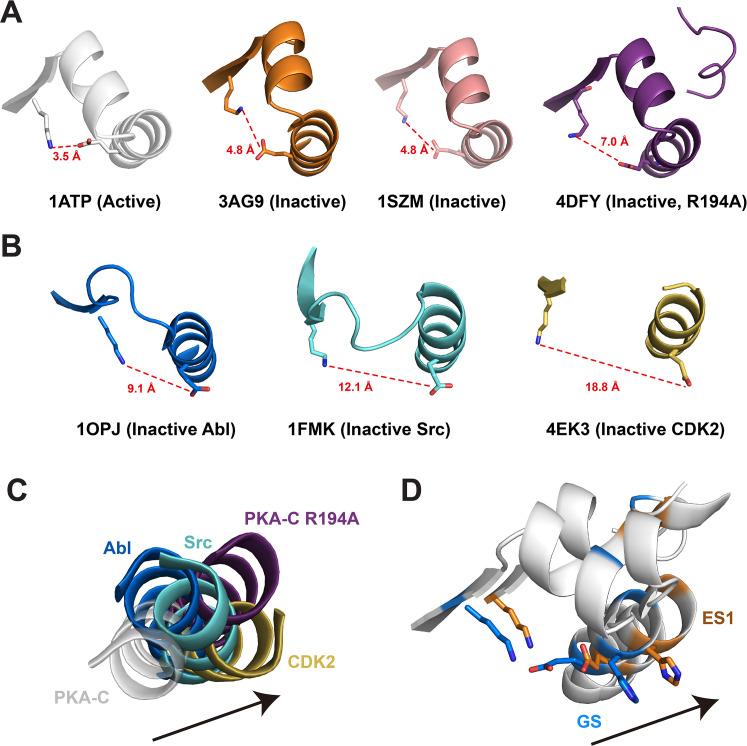
Figure 3—figure supplement 2. Structural features of αC-out transition (ES1) in various inactive kinases.

Figure 3—figure supplement 2.

(A) Crystal structures of PKA-C in active and inactive states highlight the αB-αC loop alterations. Crystal structures of PKA-C in the active (1ATP) and inactive conformations (3AG9, 1SZM, 4DFY), highlighting the electrostatic interactions between K72 in β3 and E91 in the αC. (B) Disruption of the K72–E91 salt bridge in the inactive structures of Abl (1OPJ), Src (1FMK), and CDK2 (4EK3). (C) The αC helix orientation of active PKA-C compared to the orientation in inactive kinases. (D) Structural transition from the ground state (GS) to ES1 state characterized by the outward movement of the αC helix (i.e., kinase inactivation).
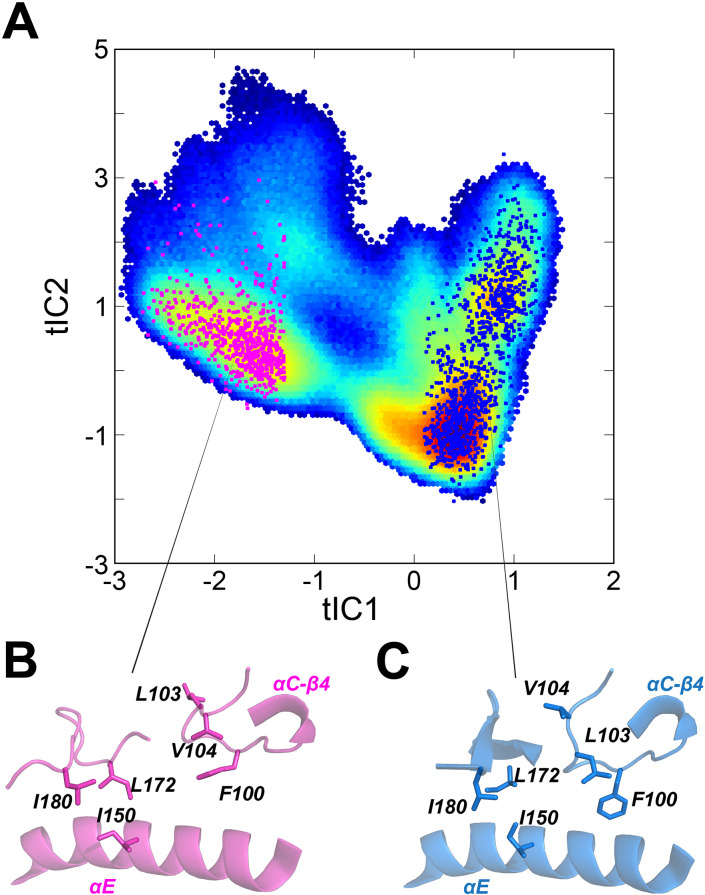
Figure 3—figure supplement 3. Distinct hydrophobic packing for residues around the αC-β4 loop in the ground state (GS) and ES states of apo PKA-C.

Figure 3—figure supplement 3.

(A) Projections of randomly selected conformations for the GS (blue) and ES (magenta) onto the conformational landscape of apo PKA-C. Snapshots with tIC1 <1.2 were clustered to separate the ES and GS, whereas those confomers with tIC1 >0.2 were clustered as GS. (B, C) Close up of the hydrophobic packing in the ES and GS (C) states, highlighting Leu103, Val104, Ile150, Leu172, and Ile180 that show slow exchange in the Carr–Purcell–Meiboom–Gill (CPMG) experiments.