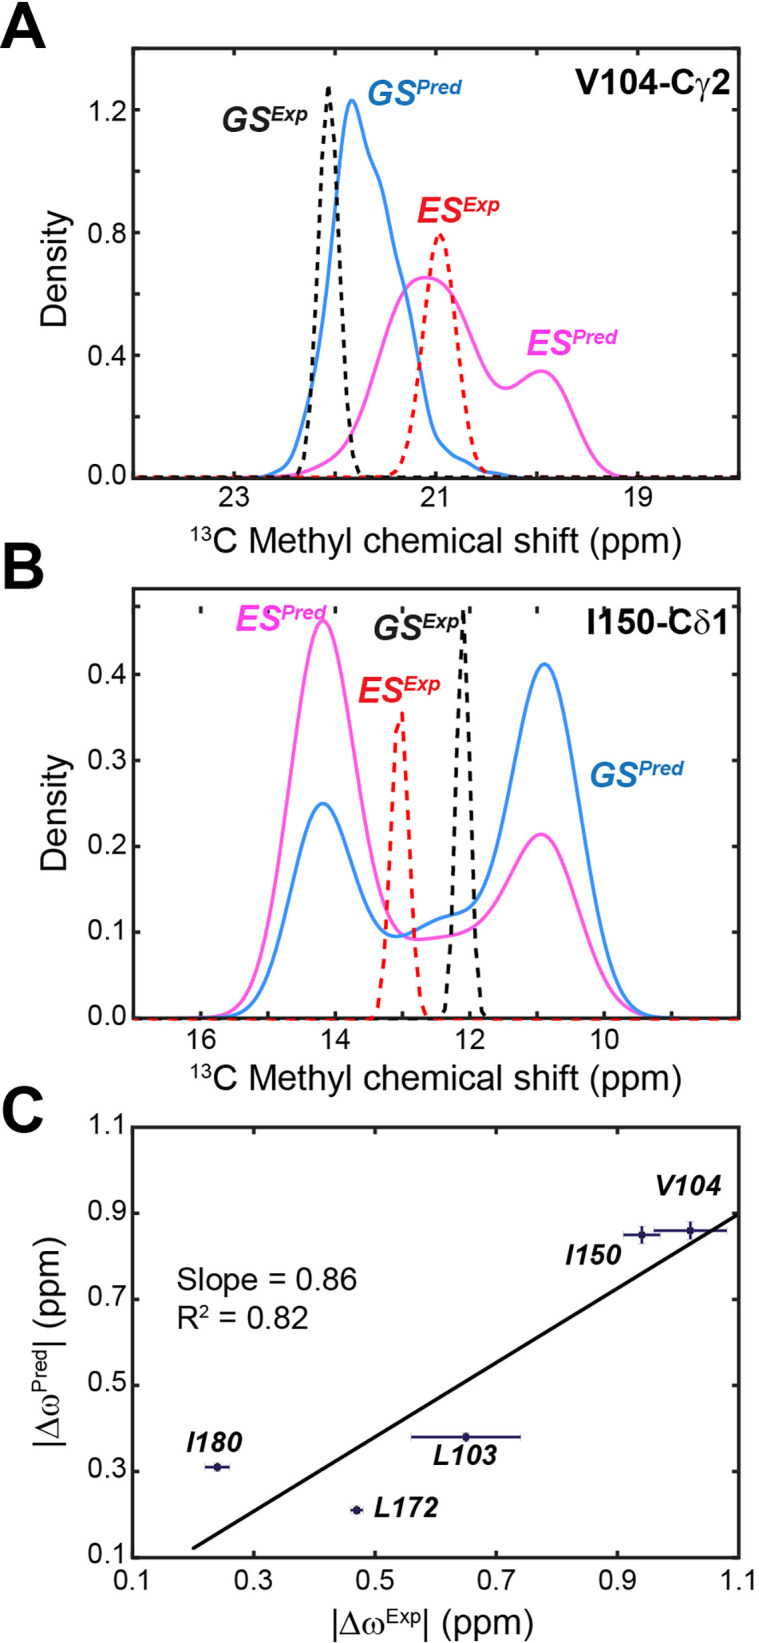
Figure 5. Comparison of experimental versus calculated 13C chemical shifts (CSs) of methyl groups of PKA-C.
(A) Experimental and calculated CS for Val104-Cγ1 of apo PKA-C. The ground state (GS) is in blue and the ES in magenta. (B) Corresponding CS profiles for Ile150-Cδ1. The experimental CS is shown in dotted lines for GS (black) and ES (red). (C) Correlation between predicted |ΔωPred| and experimental |ΔωExp| CS differences for methyl groups near the αC-β4 loop. The fitted linear correlation has a slope of 0.86 and R2 of 0.82. The experimental errors were estimated from the signal-to-noise ratios of the CEST spectra.

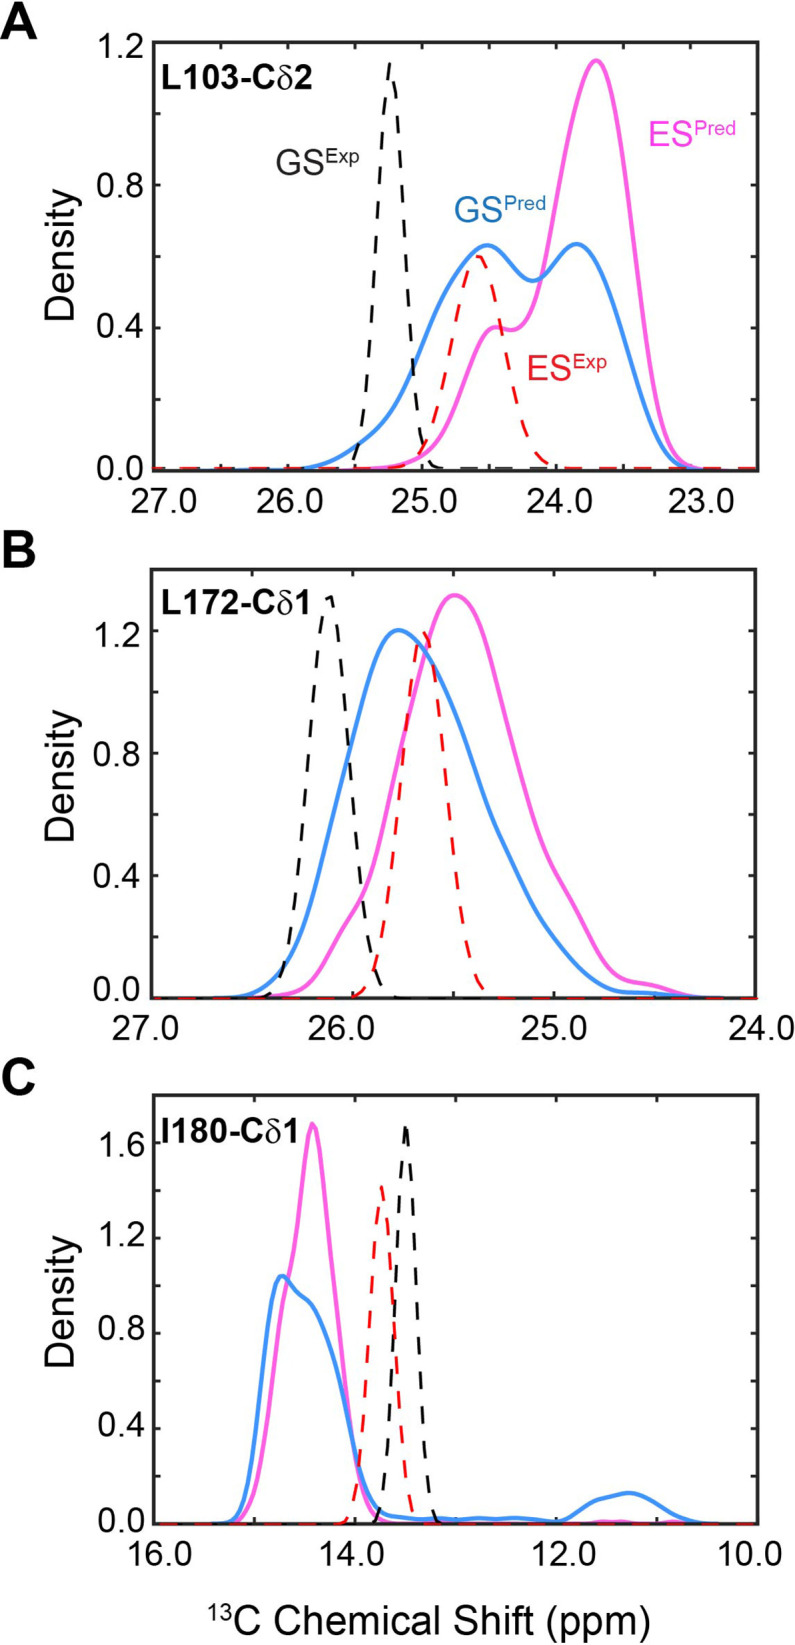
Figure 5—figure supplement 1. Distribution of predicted and experimental 13C chemical shift (CS) of selected methyl groups.

