. 2024 Jun 24;12:RP91506. doi: 10.7554/eLife.91506

Figure 9. NMR map of the structural response of PKA-CF100A to nucleotide and protein kinase inhibitor (PKI) binding.

(A) Comparison of the chemical shift perturbation (CSP) of the amide resonances for PKA-CF100A (black) and PKA-CWT (cyan) upon ATPγN binding. The dashed line indicates one standard deviation from the average CSP. (B) CSPs of PKA-CF100A/ATPγN amide resonances mapped onto the crystal structure (PDB: 4WB5). (C) Comparison of the CSPs of the amide resonances for PKA-CF100A and PKA-CWT upon binding ATPγN and PKI5-24 (black). (D) CSPs for the F100A/ATPγN/PKI complex mapped onto the crystal structure (PDB: 4WB5).

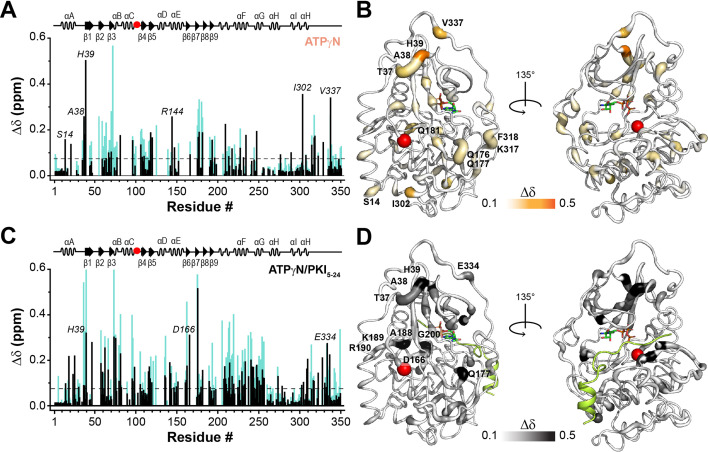
Figure 9.

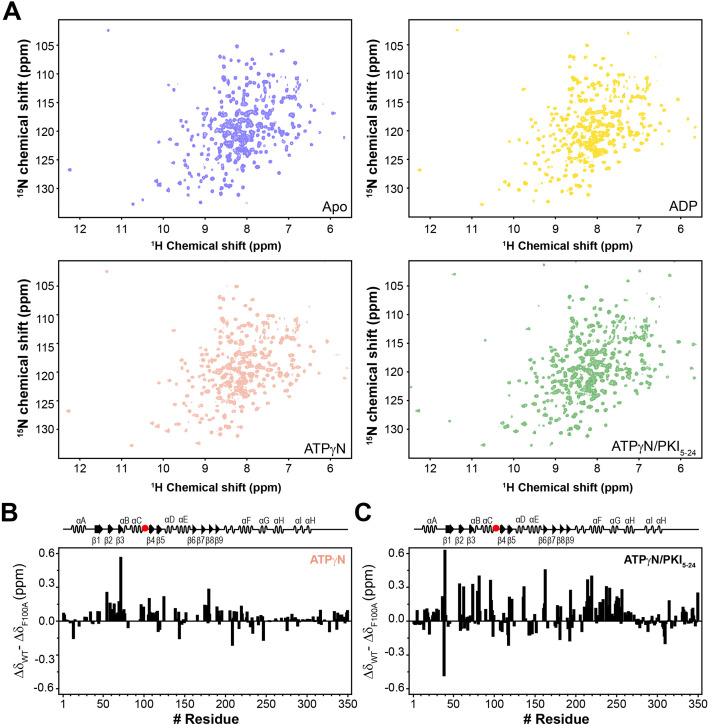
Figure 9—figure supplement 1. NMR fingerprints of PKA-CF100A.

Figure 9—figure supplement 1.

(A) [1H,15N]-WADE-TROSY spectra of apo, ADP-, ATPγN-, and ATPγN/PKI5-24-bound PKA-CF100A. (B) Changes in the chemical shift perturbation (CSP) between PKA-CWT and PKA-CF100A bound to ATPγN. (C) Changes in CSP (ΔδWT − ΔδF100A) upon binding ATPγN and PKI5-24.
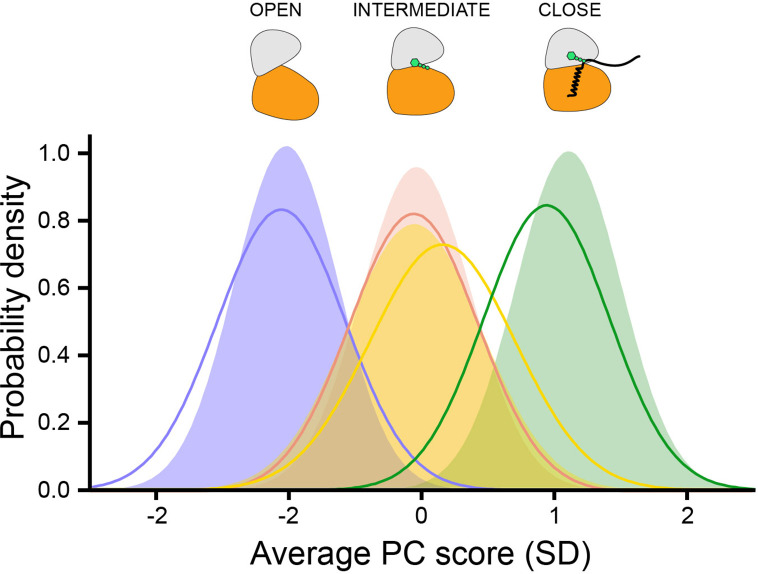
Figure 9—figure supplement 2. COordiNated ChemIcal Shifts bEhavior (CONCISE) plot showing the shifts of the probability distribution of the amide resonances as a function of nucleotides and substrate binding.

Figure 9—figure supplement 2.

The per-residue chemical shift information is averaged into the average principal component (PC) score indicative of the position of each conformational state of the kinase along the open-to-closed equilibrium.