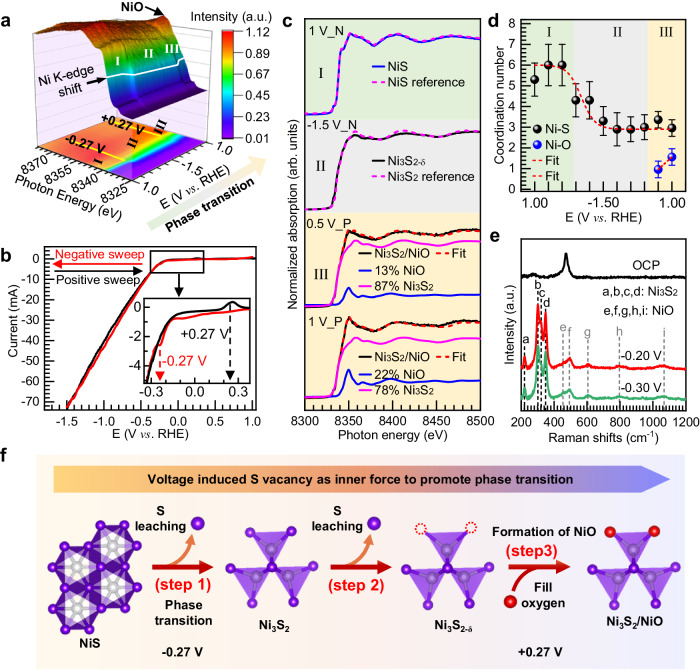
Fig. 2. Operando characterizations and the mechanism of phase transition.
a Operando Ni K-edge XAS for NiS catalyst as a function of applied voltages. Top panel shows a 3-dimensional view of Ni K-edge XAS spectra; bottom shows a 2-dimensional projection from a 3-dimensional view. b The corresponding CV profile used for the operando XAS measurement. The inset shows the magnified region marked in the rectangular box. c The Ni K-edge XAS spectra at specific applied voltages of +1.00 V (1 V_N means +1.00 V in negative sweep of CV), −1.50 V (−1.50 V_N means −1.50 V in negative sweep of CV), and +0.50 V, +1.00 V (+0.50 V_P and +1.00 V_P mean +0.50 V and +1.00 V in positive sweep of CV) in region I, II, and III respectively, extracted from Fig. 2a, and their linear combination of Ni3S2 and NiO. d The coordination number of Ni as a function of applied voltages. e Operando Raman spectroscopy of NiS at different applied voltages. f Schematic illustration for phase transition of NiS catalyst during HER measurement.

