
FIGURE 4.
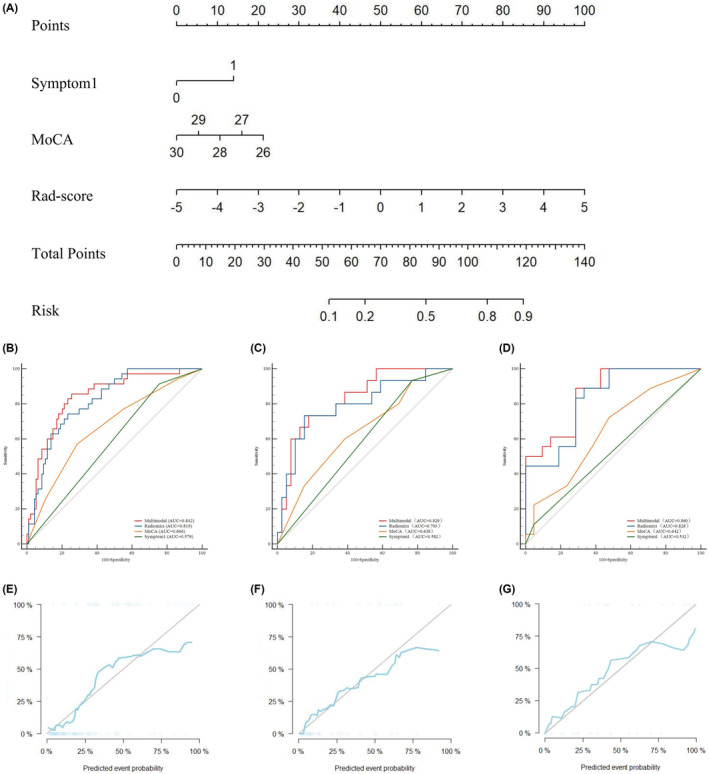
A shows the Radiomics nomogram for the prediction of PD‐MCI. The radiomics nomogram is developed in the training set with two clinical features (MoCA, Symptom1) and Rad‐score. B, C, and D show the diagnostic performance of the multimodal combinatorial model, radiomics model, MoCA score, and Symptom1 in the training, test, and validation sets, respectively. E, F, and G show the correction curves for the training, test, and validation sets, respectively.