FIGURE 7.

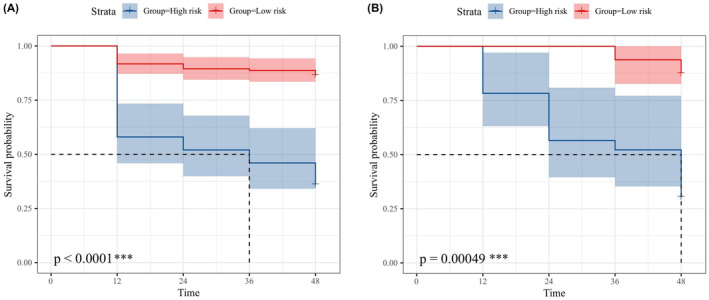
The survival curve analysis of low‐risk and high‐risk groups based on the multimodal combinatorial model classification in the PPMI (A) and NACC (B), respectively. ***p < 0.001.

The survival curve analysis of low‐risk and high‐risk groups based on the multimodal combinatorial model classification in the PPMI (A) and NACC (B), respectively. ***p < 0.001.