
FIGURE 7.
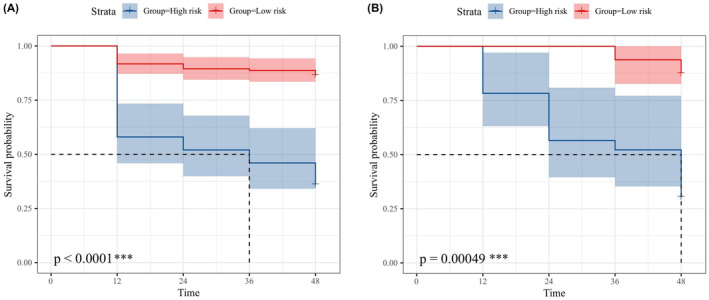
The survival curve analysis of low‐risk and high‐risk groups based on the multimodal combinatorial model classification in the PPMI (A) and NACC (B), respectively. ***p < 0.001.
Official websites use .gov
A
.gov website belongs to an official
government organization in the United States.
Secure .gov websites use HTTPS
A lock (
) or https:// means you've safely
connected to the .gov website. Share sensitive
information only on official, secure websites.
The survival curve analysis of low‐risk and high‐risk groups based on the multimodal combinatorial model classification in the PPMI (A) and NACC (B), respectively. ***p < 0.001.