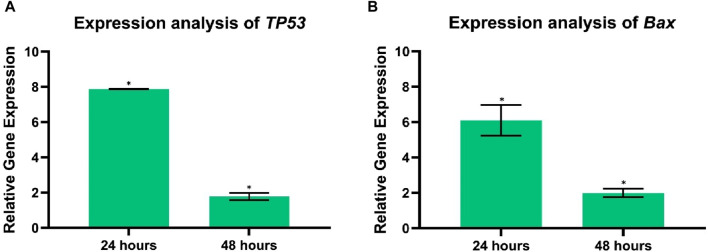
FIGURE 12.
Analysis of tumor suppressor gene and apoptosis-related gene expression (A) TP53, (B) Bax in control, and HCT-116 treated cells after 24 and 48 h of incubation time. Each bar graph represents the mean values of relative fold change ± standard deviation obtained from triplicate assays. *p < 0.05.

