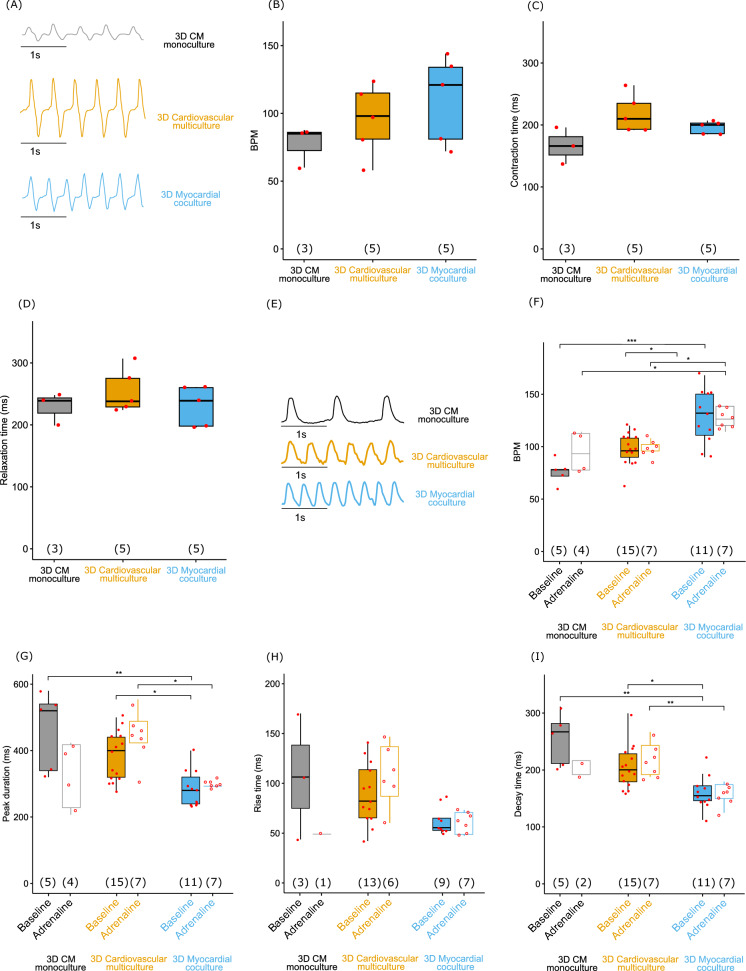
Fig. 6.
Representative beating traces of CM in 3D monoculture, cardiovascular multiculture and myocardial co-culture (A). Video microscopy analysis of (B) beating rate (Beats Per Minute, BPM), C duration of contraction and D relaxation time of 3D CM monoculture (control), cardiovascular multiculture, and myocardial co-culture in EGM-2:EB 5% medium at day 14 did not show statistically significant differences between the groups. Ca2+ transients analyzed from 3D CM monoculture (control), cardiovascular multiculture, and myocardial co-culture in EGM-2:EB 5% medium at day 14 baseline and after adrenaline exposure. Representative calcium traces at baseline (E). Data is represented as beating rate (BPM) (F), peak duration (G), rise- (H) and decay time (I). * p < 0.05, ** p < 0.01, *** p < 0.001; Kruskal–Wallis test with Bonferroni correction. Numbers in parentheses represent the number of cells used

