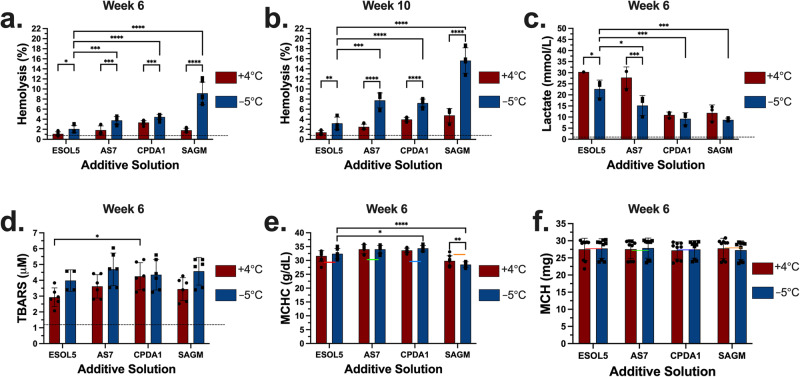
Fig. 2. Comparison of E-Sol 5, AS-7, CPDA-1, and SAGM for hemolysis, hemolysis-corrected lactate, TBARS, MCHC, and MCH at +4 °C and −5 °C after 6 and 10 weeks of storage.
a The samples were stored for 6 weeks, and hemolysis was measured. b The samples were stored for 10 weeks, and hemolysis was measured. c Data shows lactate level corrected for hemolysis after 6 weeks. Measured total lactate level was normalized by fraction of unlysed RBCs. d Data shows TBARS levels after 6 weeks. e Data shows MCHC levels at both temperatures after 6 weeks. f Data shows MCH levels at both temperatures after 6 weeks. Colored and dashed lines represent the mean day 1 levels following 3x washing, overnight storage at +4 °C, and final 1x washing in the respective solutions. Data represent mean ± standard deviation from 3 biological replicates (N = 3) and three technical replicates (n = 3, n = 1-3 for lactate, n = 2 for TBARS) for each biological replicate. Each biological replicate was from a pool of 3 donor samples. A two-way analysis of variance (ANOVA) followed by Tukey’s post hoc test was performed to evaluate significant differences between conditions: *p < 0.05; **p < 0.01; ***p < 0.001; ****p < 0.0001. Comparisons were shown across the two temperatures for each solution and for E-Sol 5 against the other solutions. TBARS Thiobarbituric Acid Reactive Substances. MCHC mean cell hemoglobin concentration. MCH mean corpuscular hemoglobin. See Supplementary Fig. 3 for comparisons across the solutions at each temperature.

