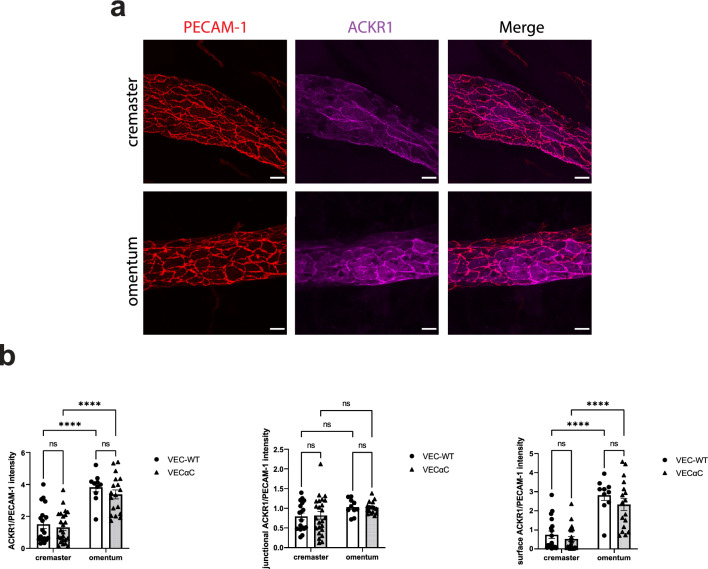
Figure 6.
Expression levels of ACKR1 on venular endothelium of omentum and cremaster. Confocal microscopic images of venules in the cremaster muscle or the omentum (as indicated on the left) stained for PECAM-1 (red) and ACKR1 (magenta); bar = 20 µm. (b) Quantification of staining intensity for ACKR1 normalized for the staining intensity of PECAM-1 was determined for total ACKR1 (left graph), for junctional ACKR1 (middle graph) and for surface ACKR1 outside of junction areas (right graph). A total of 70 vessel segments were evaluated (n = 18 VEC-WT cremaster, n = 24 VEC-αC cremaster, n = 10 VEC-WT omentum, n = 18 VEC-αC omentum) and presented as mean ± SEM. All vessel segments had diameter ranges from 60 to 85 μm. ****P < 0.0001; two-way ANOVA.

