Figure 3.

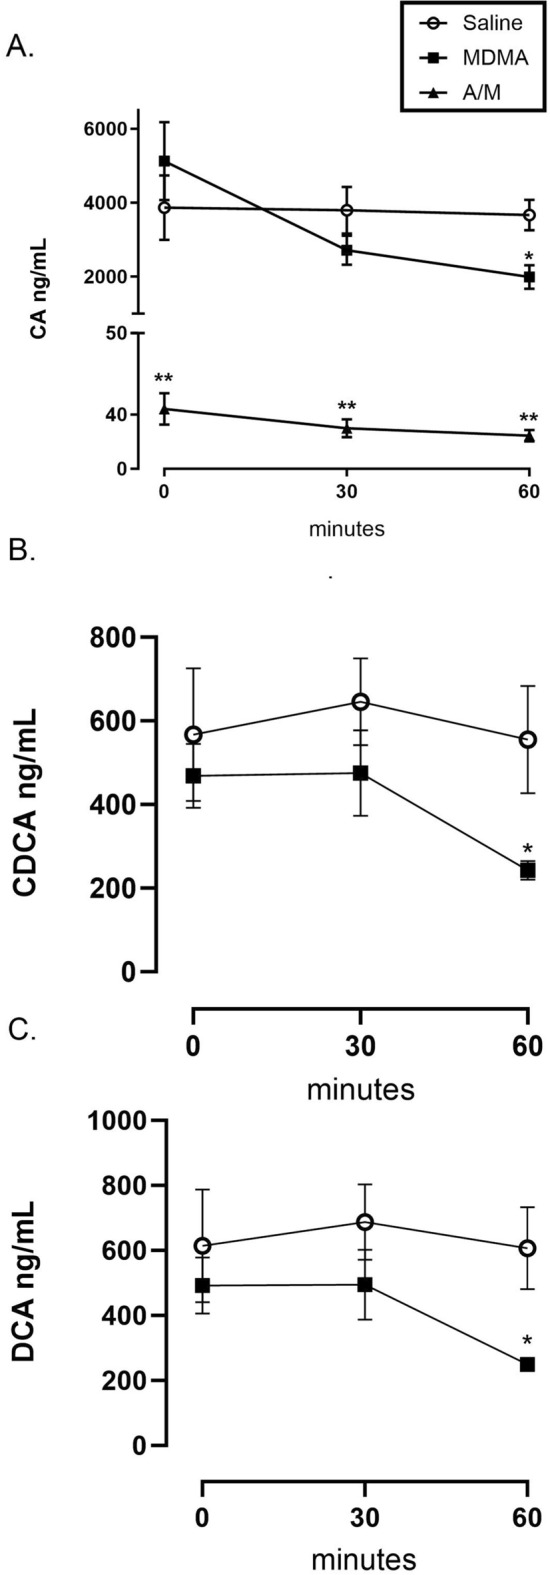
Serum bile acid levels at three different time points, pre (0 min) and post (30 min and 60 min) MDMA (20 mg/kg, sc.) or Saline administration in antibiotic treated or untreated male Sprague–Dawley rats. (A) Change in Cholic Acid (CA) levels; (B) Change in Chenodeoxycholic Acid (CDCA) levels and (C) Change in Deoxycholic Acid (DCA) levels. Both CDCA and DCA levels were below detection limits of 5 ng/mL in the A/M treatment group, hence not shown in the Figures. Each value is the mean ± SEM (n = 5 or 6). * Indicates significant difference between MDMA and saline/control value at the same time point p < 0.05 using a t-test. ** Indicates significant difference between A/M and all other treatment groups (F(2, 9) = 25.266; one-way ANOVA with Student–Newman–Keuls post hoc test; p < 0.0002).
