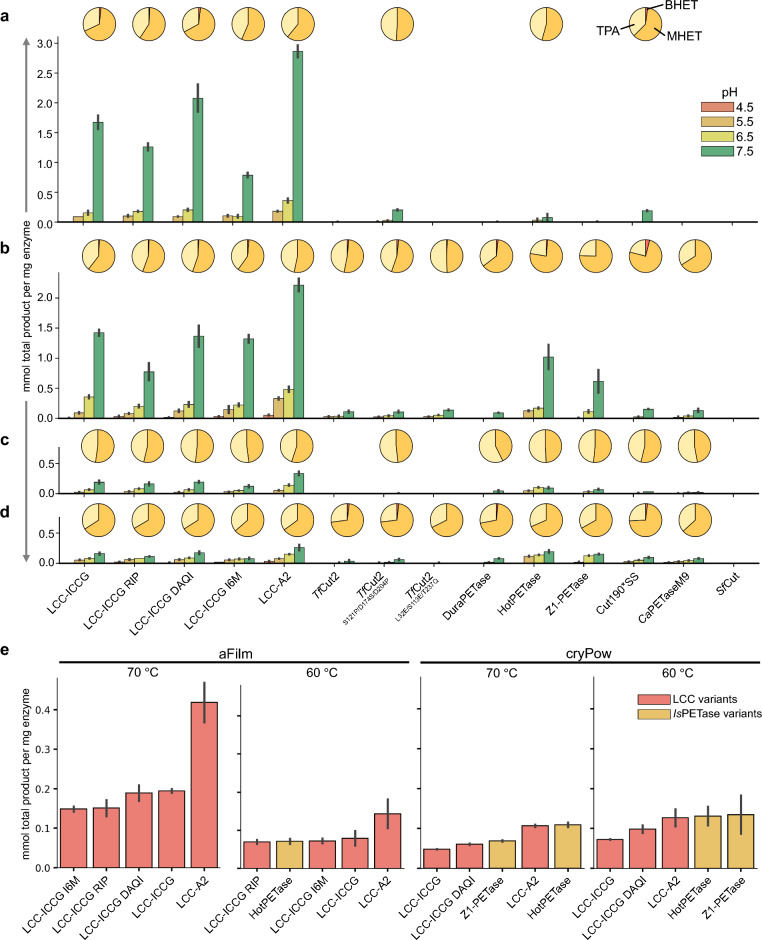
Figure 3.
PET-hydrolysis activity. Enzymes with sufficient expression yields and Tm values greater than 70 °C were assayed for PET-hydrolysis activity for 6 pH values (4 displayed here), 2 temperatures, 2 substrates, 2 timepoints, in duplicate. The results are shown for (a) amorphous film (aFilm) at 70 °C, (b) aFilm at 60 °C, (c) crystalline powder (cryPow) at 70 °C, and (d) cryPow at 60 °C with bar charts showing mmol product formation per mg of enzyme added after 24 h for pH 4.5, 5.5, 6.5, and 7.5 as determined by UV–Vis analysis. The error bars represent the range between two biological replicates. The pie charts above each pH series show the product ratios of TPA, MHET, and BHET after 24 h for pH 7.5 determined by HPLC analysis. (e) Product formation after 2 h for the five top-performing enzymes in each condition at pH 7.5 determined by UV–Vis analysis. From left to right: aFilm at 70 °C, aFilm at 60 °C, cryPow at 70 °C, and cryPow at 60 °C. The error bars represent the range between two biological replicates.
Source data for this figure is provided in the Supplementary Source Data file.

