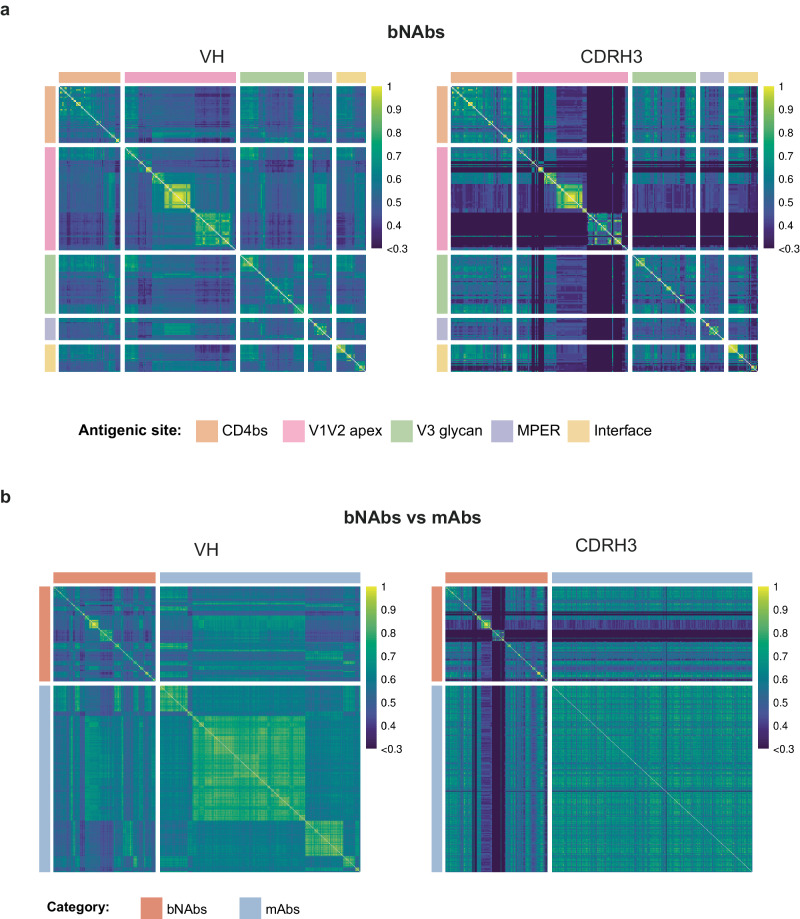
Fig. 2. Sequence similarity matrices of HIV-1 bNAbs and control mAbs.
a Similarity matrices for 255 bNAbs grouped by antigenic site for the entire VH (left) or the CDRH3 only (right). b Similarity matrices of bNAbs versus mAbs with entire VH (left) and CDRH3 only (right). In the heatmaps, sequences are ranked based on their V and J genes. In both cases, matrices were created using ANARCI. The similarity scores, ranging from 0 to 1, indicate the degree of similarity between sequences, with higher scores representing lower Levenshtein distances. b mAb sequences were downsampled to 500 to enable display. Source data are provided as a Source Data file.

