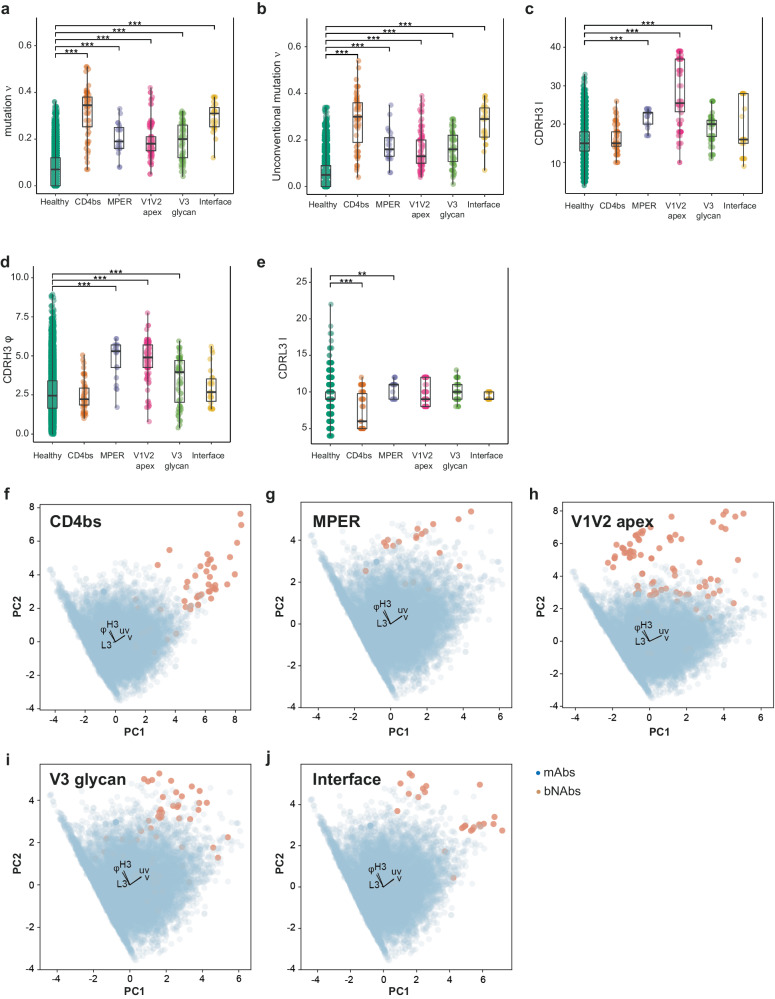
Fig. 3. Characteristics discriminating HIV-1 bNAbs from mAbs.
Specific properties of antibodies that allow differentiation between bNAbs and mAbs depending on the antigenic site. Shown is boxplots with center line denoting the median value (50th percentile), while the black box contains the 25th to 75th percentiles of the dataset. The black whiskers mark the 5th and 95th percentiles. a Mutation frequency (ν), b unconventional mutation frequency (uν), c CDRH3 length (H3), d CDRH3 hydrophobicity (φ), and e CDRL3 length (L3) were statistically compared with Kruskal–Wallis’s test followed by Dunn’s post hoc test. Only significant comparisons with mAbs are shown, with: *P < 0.05, **P < 0.01, and ***P < 0.005. f–j Principal component analysis (PCA) of the immunoglobulins using five features (ν, uν, H3, φ, and L3). The feature weight for PC1 (Principal Component 1) and PC2 (Principal Component 2) is shown by black arrows. Each bNAb category is represented by a single plot per antigenic site, f CD4bs, g MPER, h V1V2 apex, i V3 glycan, and j gp120/gp41 interface. For data in (a–e), sequences number is n = 14,962 for healthy, n = 54 for CD4bs, n = 21 for MPER, n = 98 for V1V2 apex, n = 56 for V3 glycan and n = 26 for Interface. Adjusted P values with the Holm method are as follows: (a) healthy vs CD4bs P = 2.04e-31, MPER P = 1.72e-10, V1V2 P = 5.94e-44, V3 P = 1.06e-20 and interface P = 3.00e-17. b Healthy-CD4bs P = 1.51e-30, MPER P = 4.87e-10, V1V2 P = 7.90e-34, V3 P = 3.08e-21 and interface P = 1.03e-16. c Healthy-MPER P = 1.04e-09, V1V2 P = 5.33e-45 and V3 P = 3.12e-10. d Healthy-MPER P = 3.97e-08, V1V2 P = 8.92e-36 and V3 P = 6.08e-04. e Healthy-CD4bs P = 8.89e-10 and MPER P = 0.02. Source data are provided as a Source Data file.

