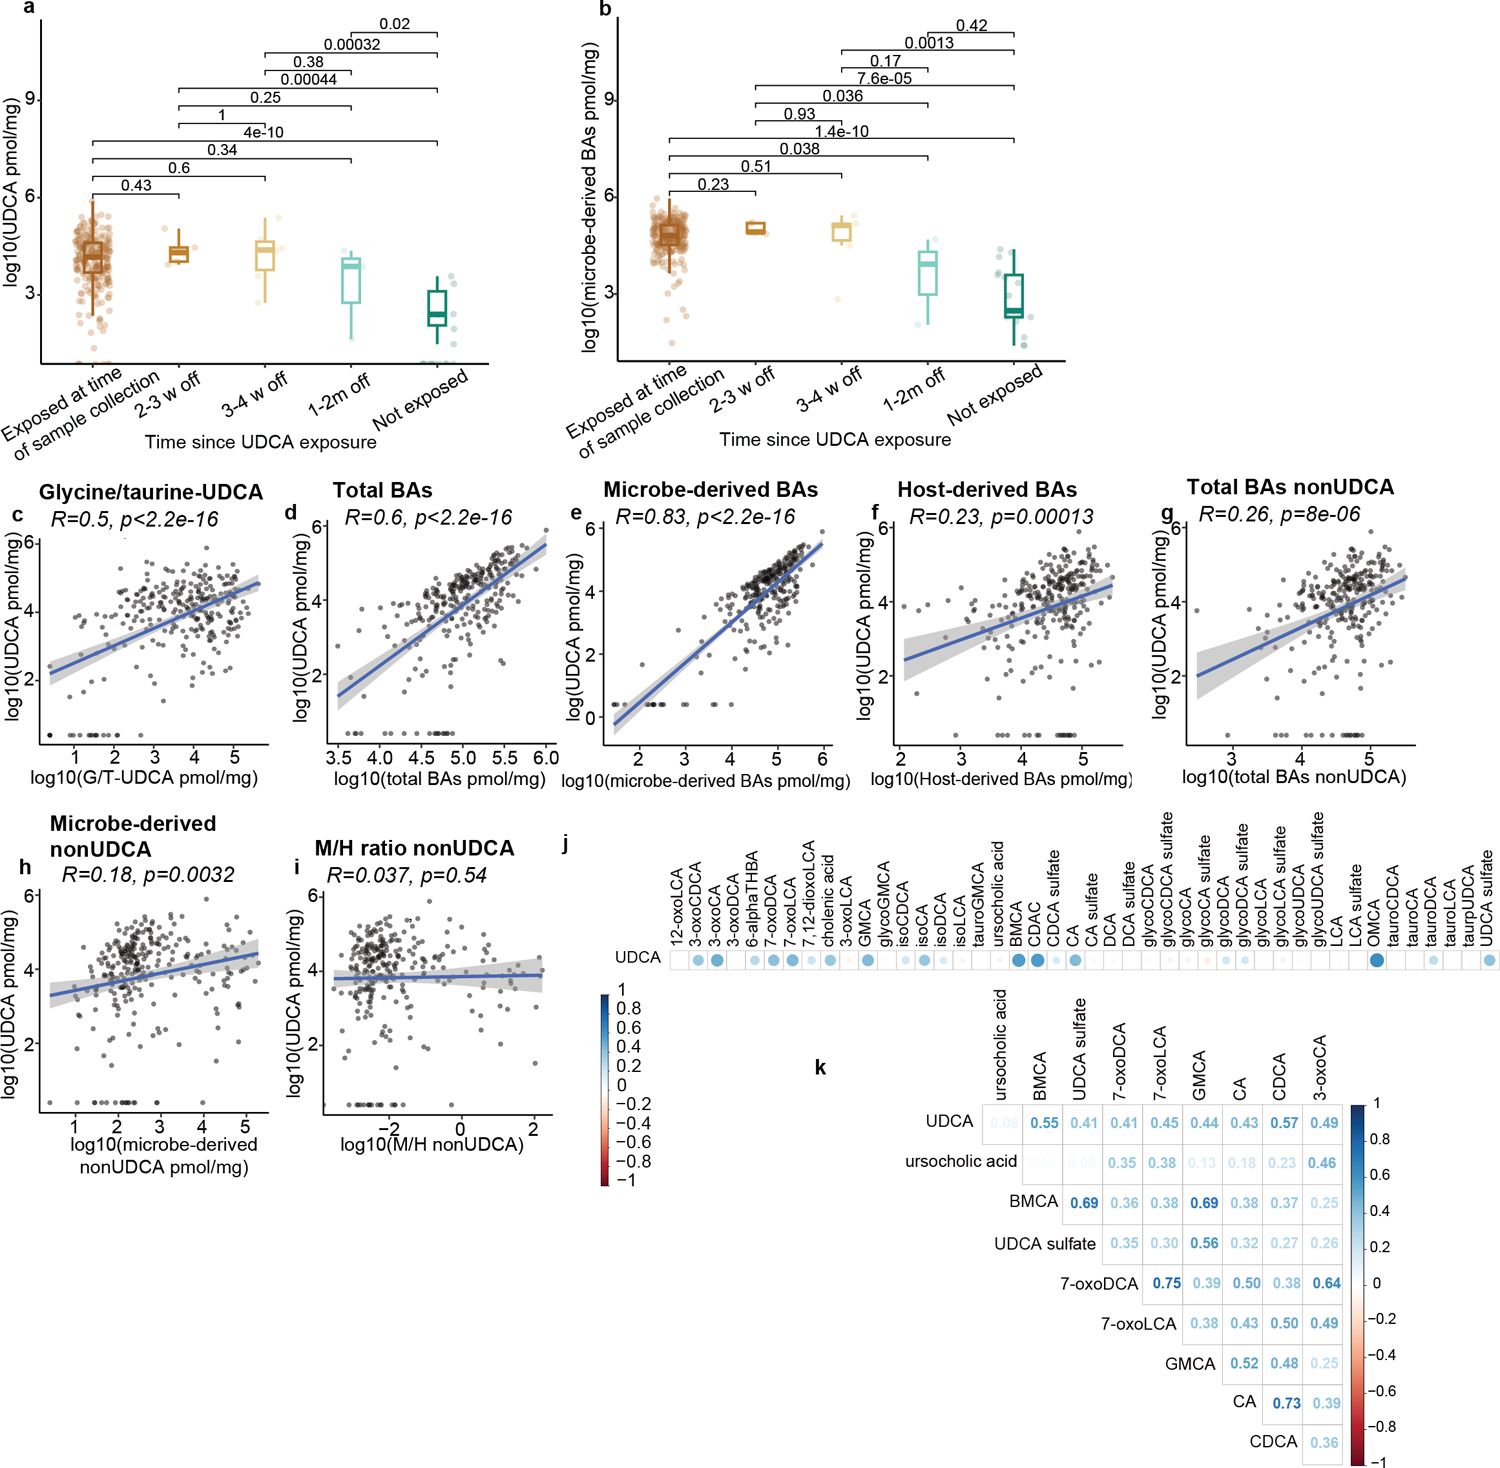
Extended Data Fig. 4.

Effects of UDCA exposure on the intestinal BA pool in n=280 samples from either peri-engraftment or peri-GVHD onset timepoints. Fecal concentrations of UDCA (a) and microbe-derived BAs (b). UDCA exposure status is shown in the x-axis (w = weeks; m = months since last exposure). Statistical significance determined by the 2-sided Wilcoxon Rank-sum test. The boxplot center line corresponds to the median, box limits correspond to the 25th and 75th percentile, and whiskers correspond to 1.5x interquartile range. Correlation of fecal UDCA concentrations with the levels of conjugated UDCA (conj-UDCA, c), total BAs (d), microbe-derived BAs (e), host-derived BAs (f), nonUDCA total BAs (g) nonUDCA microbe-derived BAs (h), and microbe- to host- derived (M/H) ratio excluding UDCA (nonUDCA, i). The solid line represents a linear regression model fitted to the data. The shaded region surrounding the line indicates a 95% confidence interval for the regression line. Total BAs nonUDCA (g) are measured in pmol/mg. (j,k) Correlation matrix of the BA species covarying with UDCA. (k) Showing BA species with a Pearson correlation coefficient (R>0.4).
