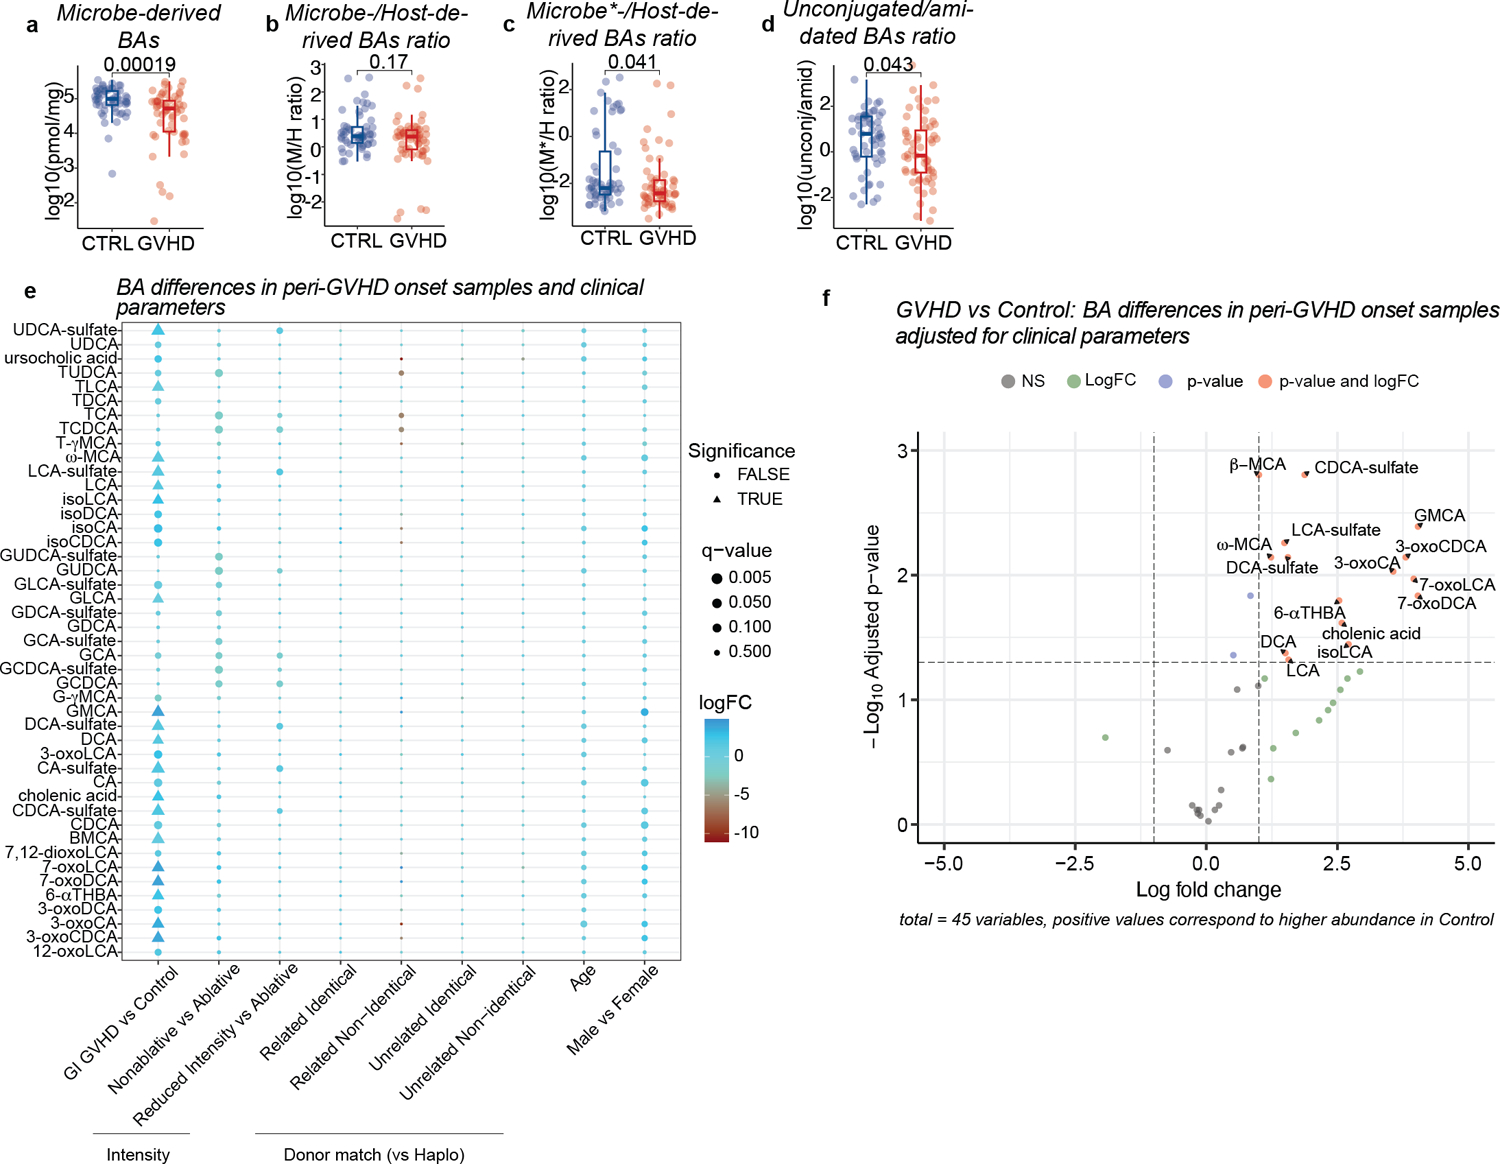
Extended Data Fig. 5.

Fecal BA profiles at the peri-GVHD onset time point. Showing the levels of total microbe-derived BAs (a), microbe- to host-derived (M/H) BA ratio (b), M*/H (i.e., nonUDCA M/H) BA ratio (c), and the ratio of unconjugated to amidated BAs (d). Data representative of 57 control and 58 GVHD patients. Statistical significance determined with the 2-sided Wilcoxon Rank-sum test. The boxplot center line corresponds to the median, box limits correspond to the 25th and 75th percentile, and whiskers correspond to 1.5x interquartile range. (e-f) Differential abundance of BAs between GVHD and controls in peri-GVHD onset samples after multivariate adjustment. (e) Grid plot showing significance status, q-values, and log fold changes of BAs relative to indicated clinical variables. (f) Volcano plot showing log-transformed adjusted p-values vs log fold changes of BAs between GVHD and control patients. Statistical comparison was made using the two-sided empirical Bayes moderated t-test and p-values were adjusted using the Benjamini-Hochberg method.
