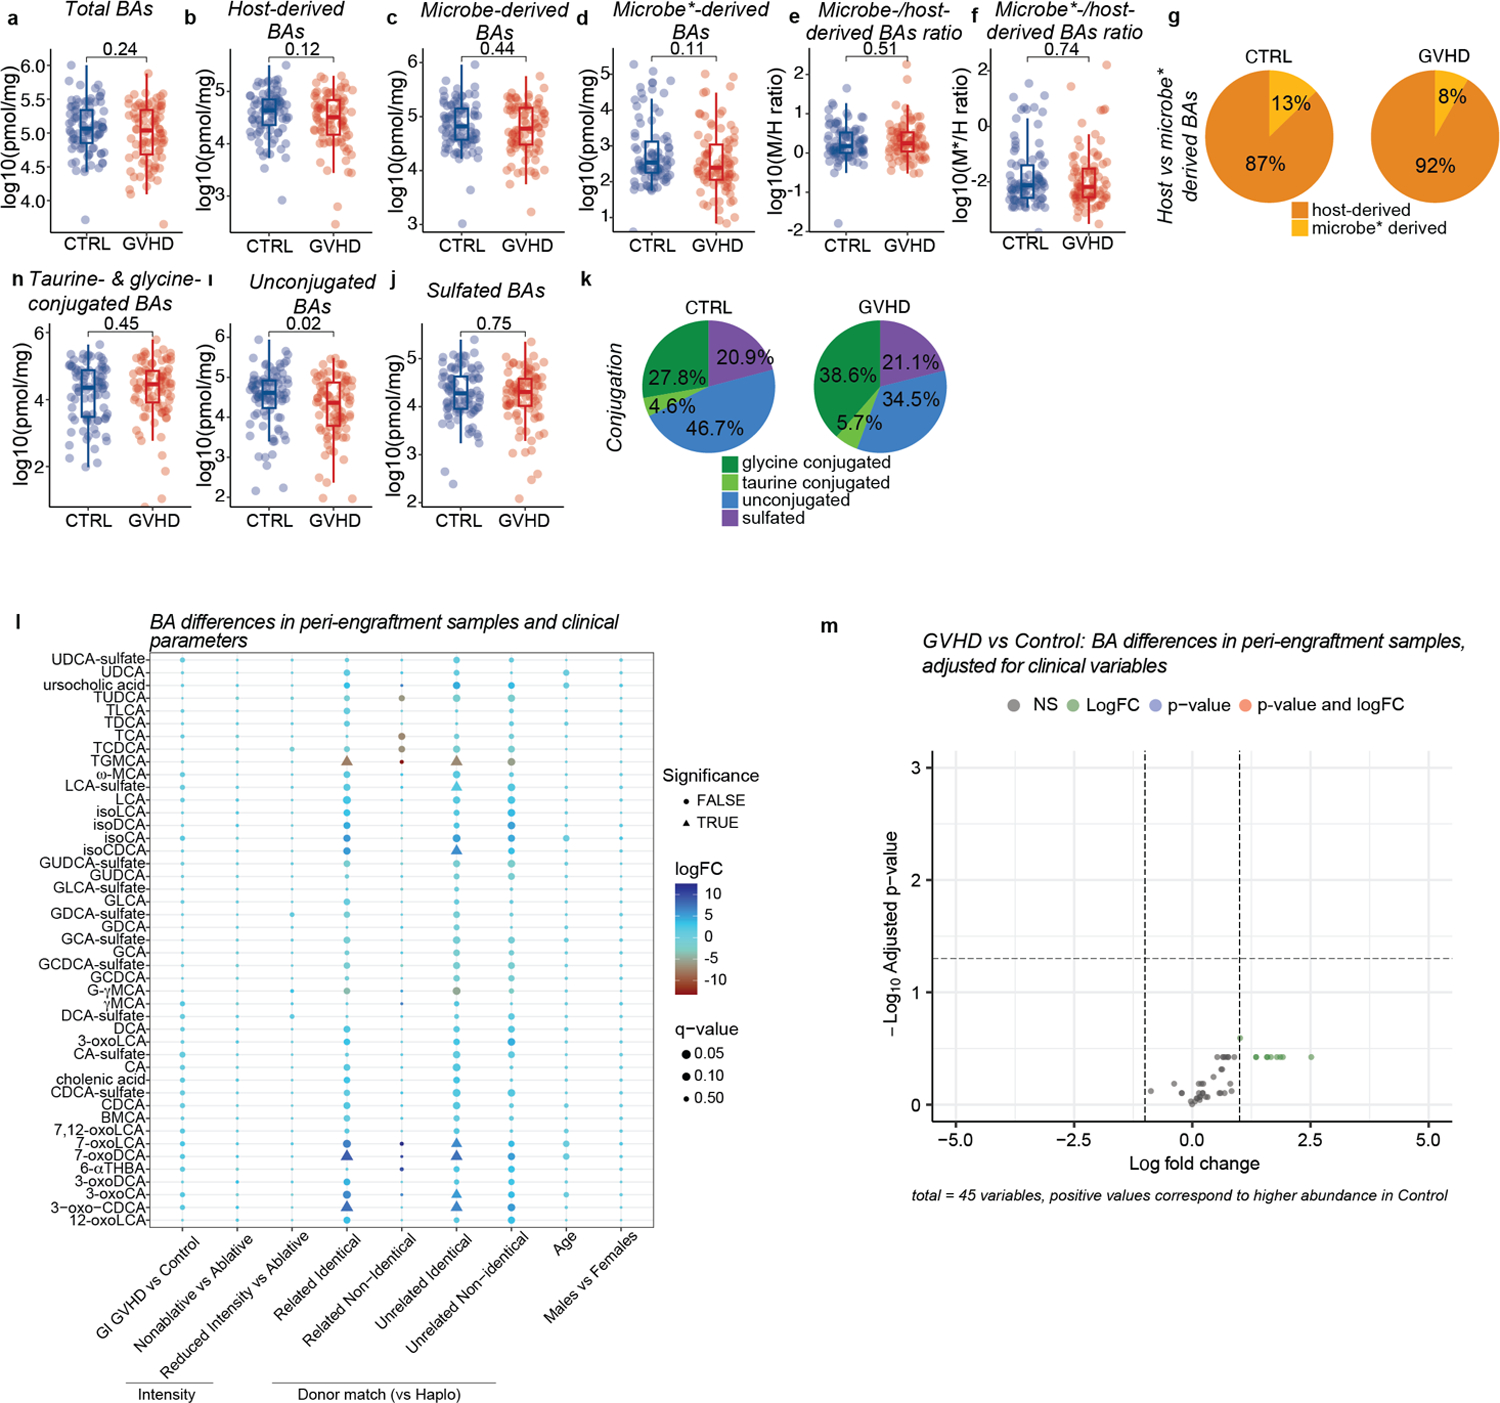
Extended Data Fig. 6.

Fecal BA profiles at the peri-engraftment time point. Total BAs (a), host-derived (b), microbe-derived (c), microbe*-derived (d), microbe-derived to host-derived (M/H) BA ratio (e), M*/H (nonUDCA M/H) BA ratio in patients that develop GVHD vs controls (f). (g) Pie chart showing the averaged relative contributions of host-derived and microbe*-derived to the calculated total BA pool. Glycine- and taurine-conjugated (h), unconjugated (i), and sulfated (g) BAs. Pie chart showing the averaged percentages of glycine- and taurine-conjugated, unconjugated and sulfated BAs in patients with GVHD vs controls in peri-GVHD onset samples (k). Microbe*-derived BAs: Microbe-derived BAs excluding UDCA. Data representative of 90 control and 86 GVHD patients. The boxplot center line corresponds to the median, box limits correspond to the 25th and 75th percentile, and whiskers correspond to 1.5x interquartile range. Statistical significance determined with the 2-sided Wilcoxon Rank-sum test. (l,m) Differential abundance of BAs between GVHD and control patients in peri-engraftment samples after multivariate adjustment (l) Grid plot showing significance status, q-values, and log fold changes of BAs relative to indicated clinical variables. (m) Volcano plot showing log-transformed adjusted p-values vs log fold changes of BAs between GVHD and control patients. Statistical comparison was made using the two-sided empirical Bayes moderated t-test and p-values were adjusted using the Benjamini-Hochberg method.
