Extended Data Fig. 8.

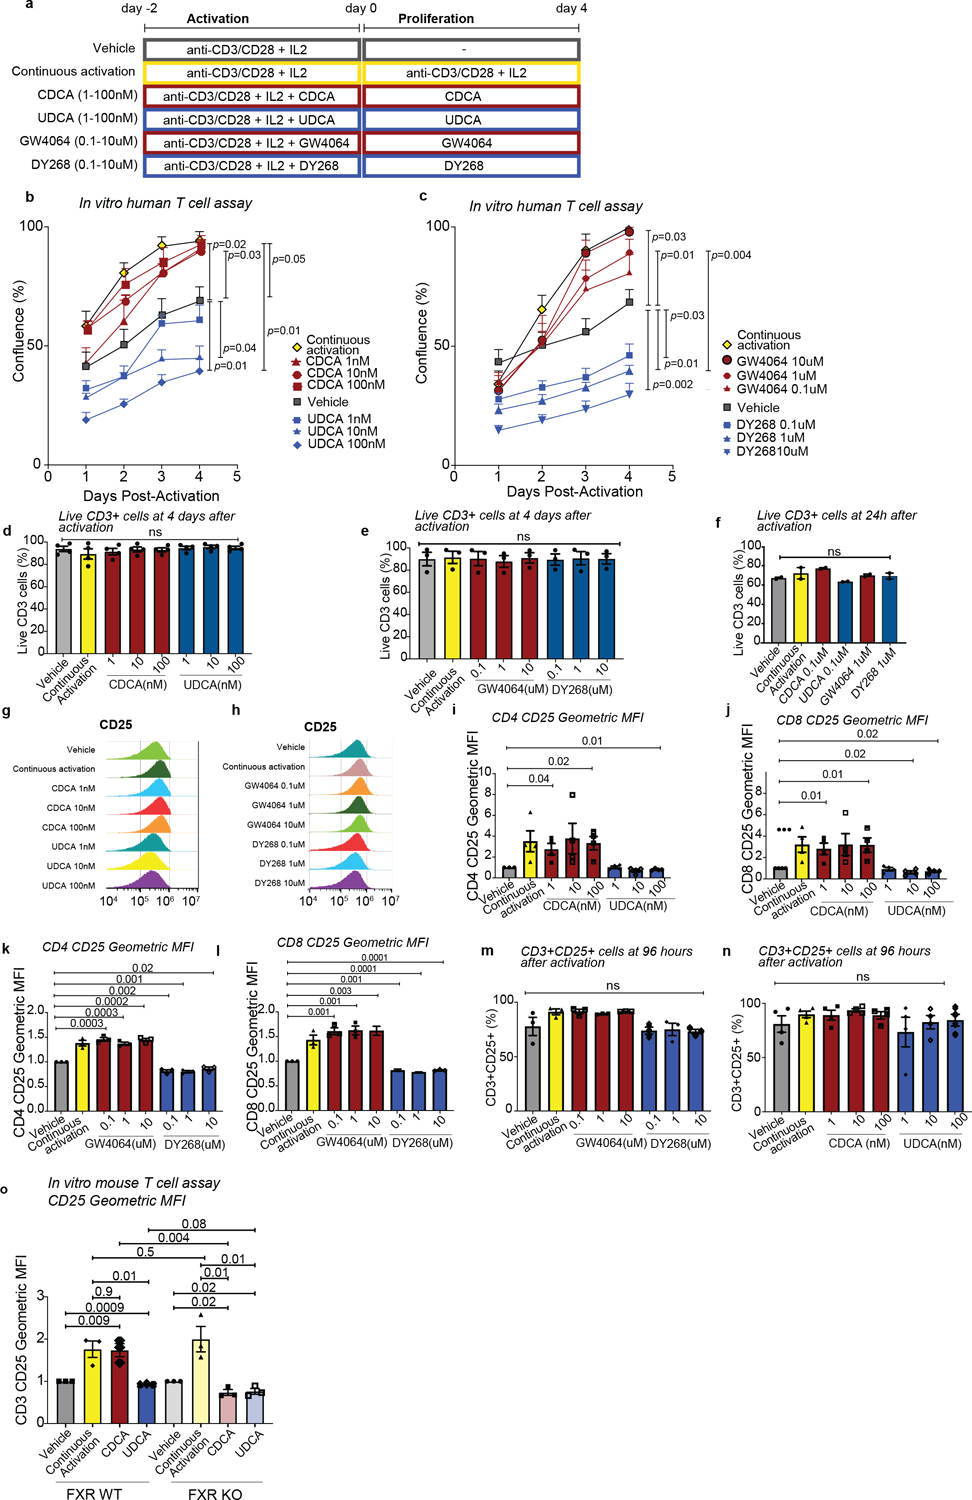
In vitro human T cell proliferation in response to FXR activation or inhibition with drugs or BAs. (a) Experimental design. Purified human T cells were activated with anti-CD3 and anti-CD28 antibodies in the presence of recombinant IL-2 for 2 days and further cultured either in the presence of anti-CD3/anti-CD28 antibodies (continuous activation control) or in their absence (vehicle control) with or without the indicated compounds for 96 hours. Showing T cell confluence in response to CDCA and UDCA (b) or GW4064 and DY268 (c) at the indicated concentrations. Cell viability (d, e, f) and representative histograms (g, h) showing CD25 levels determined by flow cytometric analysis. (i-l) CD25 expression in CD4+ and CD8+ T cells after 96 hours of treatment with CDCA and UDCA (i-j), or GW4064 and DY268 (k-l). Showing the geometric mean fluorescence intensity (MFI) of CD25 in CD25+ T cells. Values were normalized to the MFI of the vehicle-treated group. (m, n) Frequency of CD25 positive celles on day 4 post-activation. (o) CD25 expression from T cells of FXRWT or FXRWT mice treated with anti-CD3 and anti-CD28 antibodies in the presence of IL-2 for 2 days before incubation with CDCA (100nM), or UDCA (100nM), anti-CD3, anti-CD28 and IL-2 (continuous activation), or vehicle for 2 more days. CD25 expression was measured as geometric mean fluorescence intensity (MFI) of CD25 in CD25+ T cells normalized to the MFI of the vehicle-treated group. Statistical analysis was performed by two-way (b,c) or one-way ANOVA followed by multiple t-test with Bonferoni correction (d-f, i-o). Each data point in (i-n) shows the average of technical duplicates for a single donor. Bars denote the standard error of the mean. Data representative of 4 independent experiments with a total of 4 PBMC donors. Each data point in (g) shows the average of technical triplicates from two mice. Bars denote the standard error of the mean. Data representative of 3 independent experiments with a total of 6 mice.
