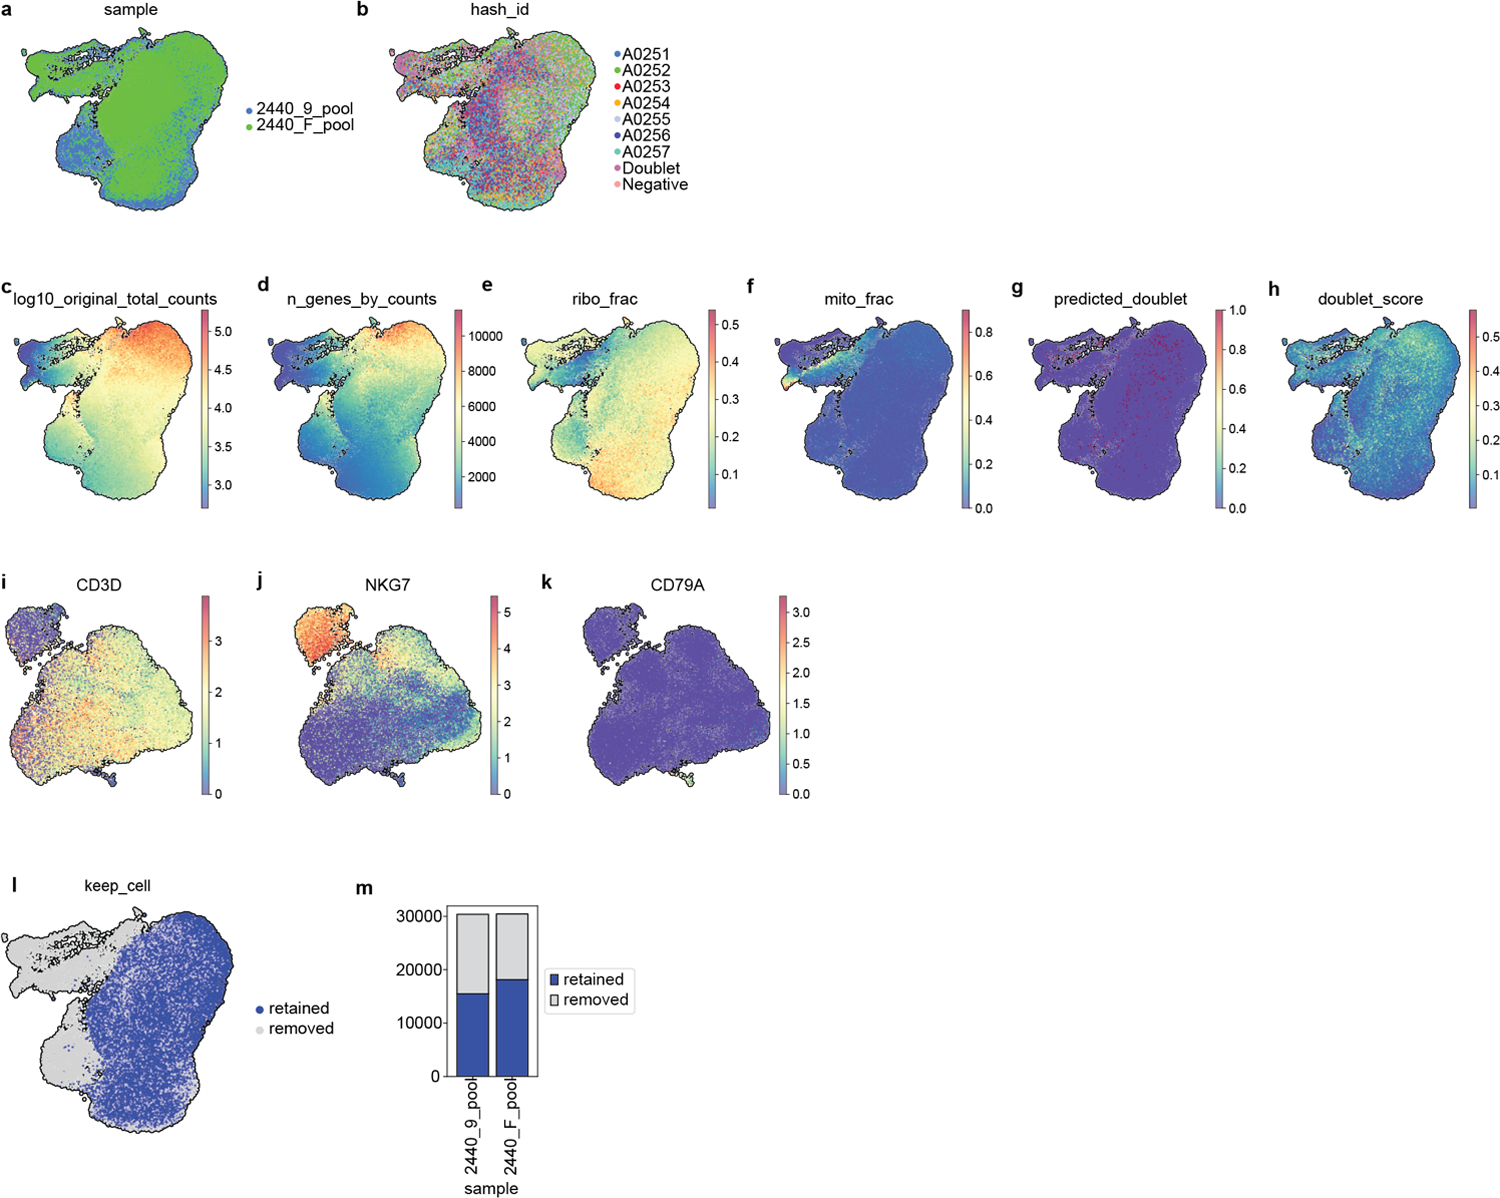
Extended Data Fig. 9.

Quality control of single cell RNA-sequencing profiling of in vitro activated T cells treated with FXR ligands, DMSO or activating signals for 24h. Visualization of 60,767 cells using a uniform manifold approximation and projection (UMAP) of (a) cells from the two donors and (b) per hashtag before eliminating any cells. (c) Total counts (log10 scale) (d) total genes, (e) ribosomal fraction, (f) mitochondrial fraction per cell, (g) predicted doublet and (h) doublet score. (i-k) Cells expressing markers for B and Natural Killer cells were defined as contaminants. (l-m) UMAP and stacked plot showing the fraction of retained (33,634) and removed cells (27,133).
