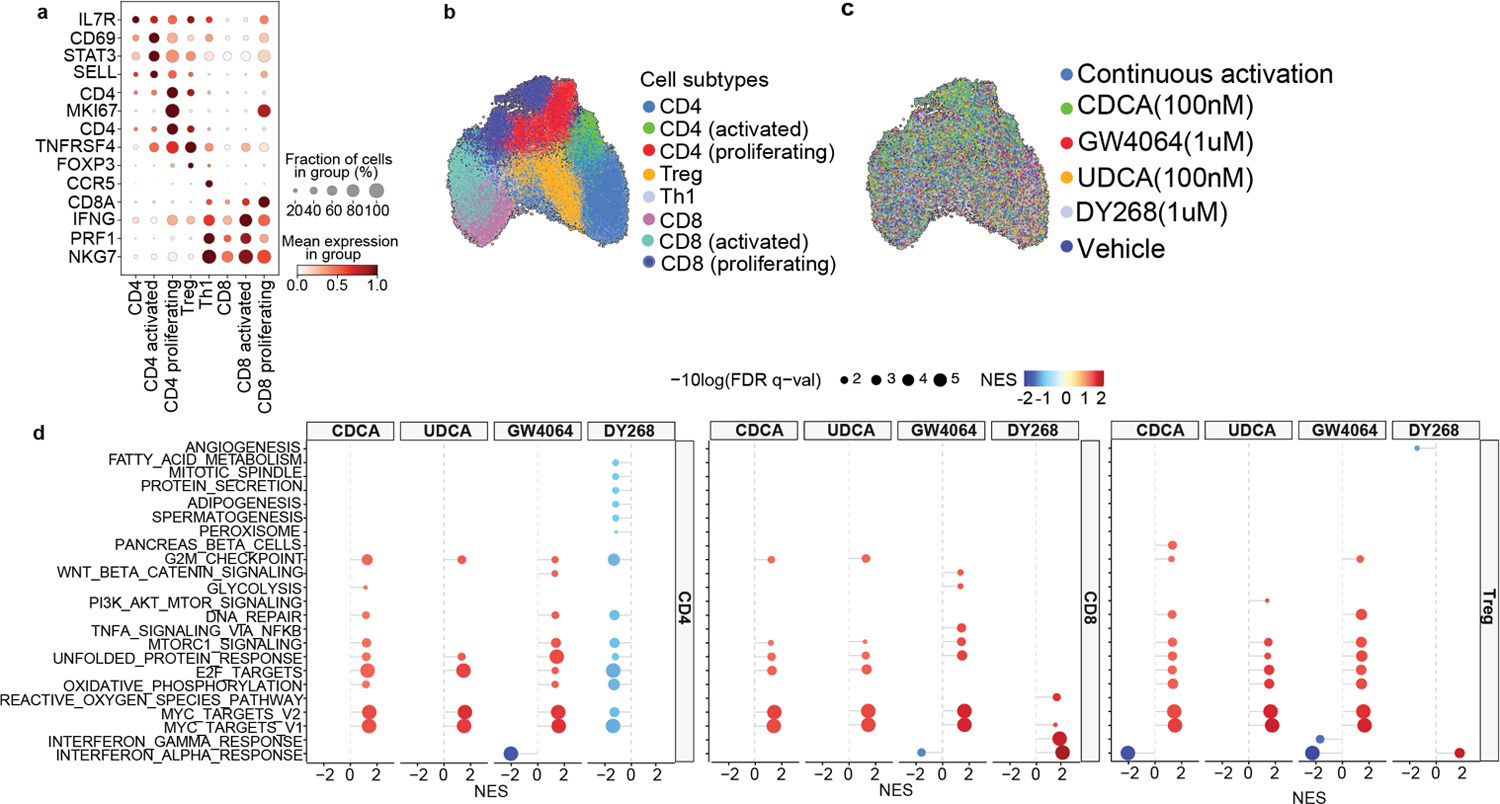
Extended Data Fig. 10.

Single cell RNA-sequencing profiling of in vitro activated T cells treated with CDCA (100nM), UDCA (100nM), GW4064 (1uM) and DY268 (1uM) for 24h. (a) Gene markers used to identify cell populations. Visualization of annotated cells using a uniform manifold approximation and projection (UMAP) of (b) subtypes after batch correction and (c) per treatment arm. (d) Gene Set Enrichment Analysis of pathways differentially regulated in the different conditions (CDCA 100nM, UDCA 100nM, GW4064 1uM, DY268 1uM) relative to the vehicle control in CD4+, CD8+ and regulatory T cell populations. Displaying significant pathways.
