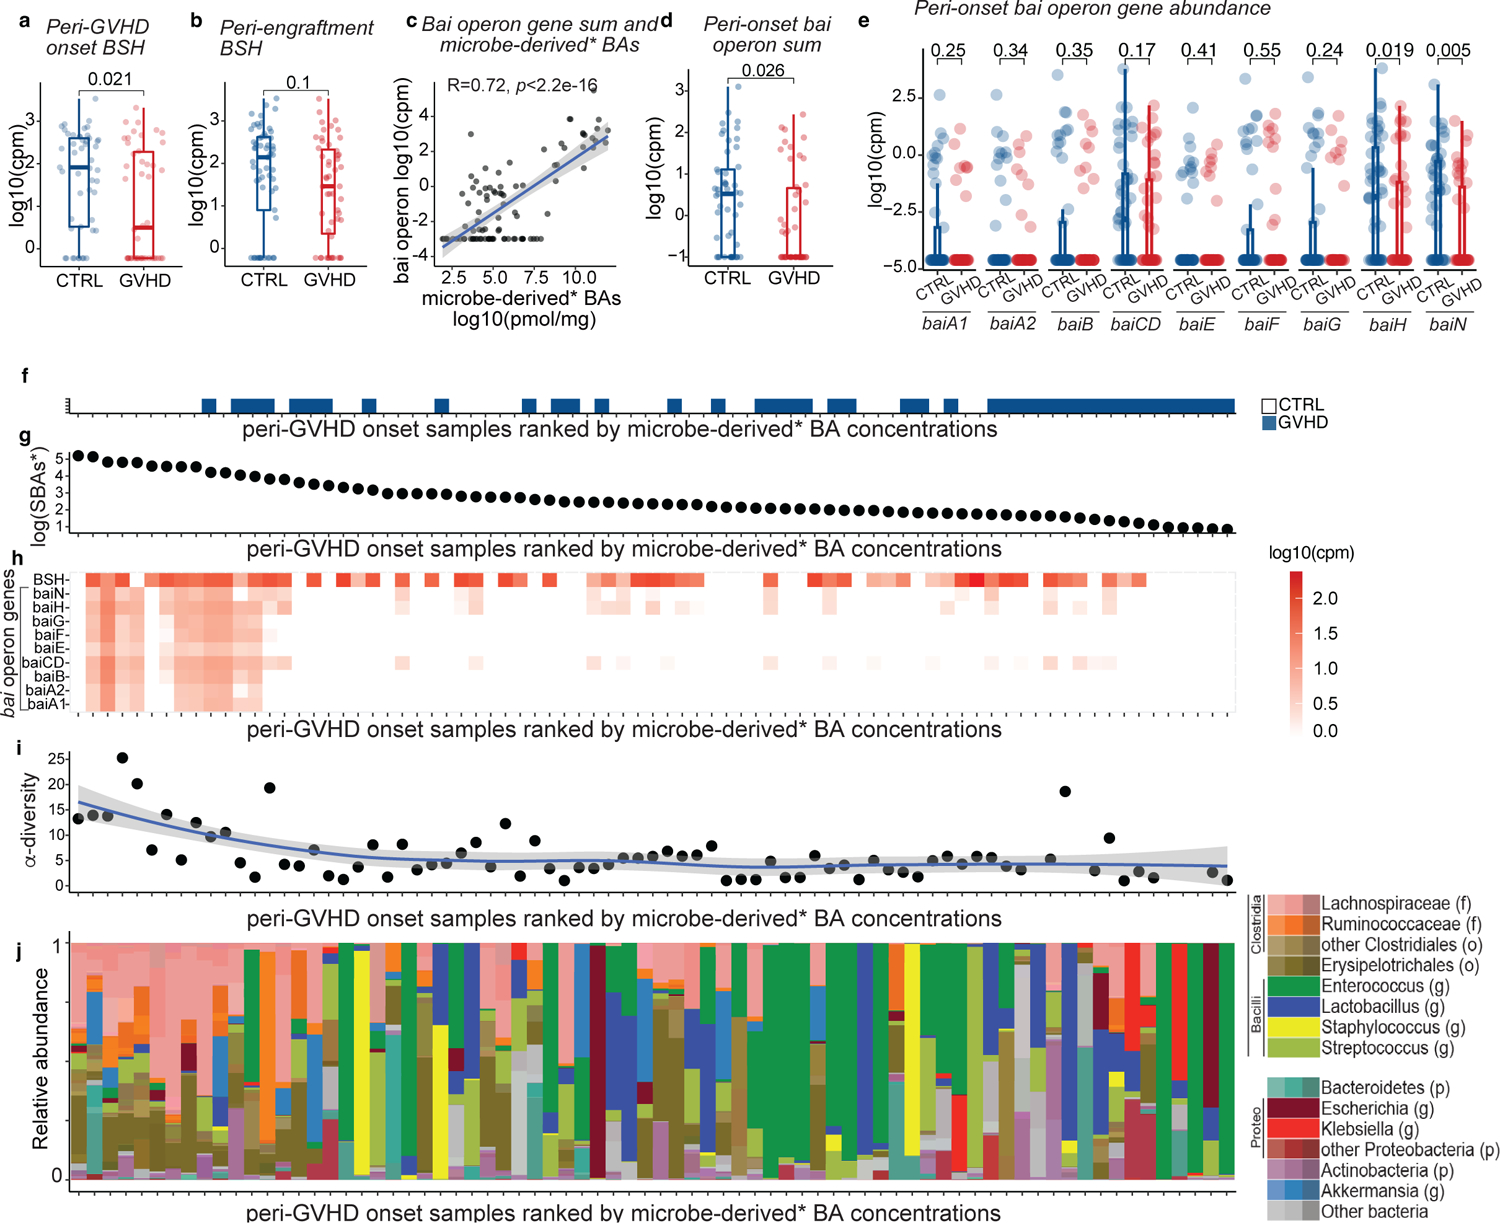
Fig. 5. BA biotransformation potential in transplant patients with GVHD vs controls.

BSH gene abundance in (a) peri-onset (n=46 with GVHD and n=49 controls) and (b) peri-engraftment (n=51 with GVHD and n=57 controls) samples of patients with GVHD vs controls. (c) Correlation between the sum of the gene counts mapping to the bai operon and microbe-derived* BAs. The solid line represents a linear regression model fitted to the data. The shaded region surrounding the line indicates a 95% confidence interval for the regression line. bai operon gene sum (d) and abundance of bai operon genes (e) in patients with GVHD vs controls in peri-GVHD onset samples (n=46 with GVHD and n=49 controls). The boxplot center line corresponds to the median, box limits correspond to the 25th and 75th percentile, and whiskers correspond to 1.5x interquartile range. Statistical significance determined with the 2-sided Wilcoxon Rank-sum test. R was calculated with Pearson correlation. (f-j) Landscape of sample-specific characteristics in peri-GVHD onset samples, ranked from higher to lower microbe-derived* BAs. Showing GVHD incidence (f), concentration of microbe-derived*(g), and BSH and bai operon gene abundance (h). α-diversity calculated with the Simpson reciprocal index (i) and microbiome composition (j). Microbe-derived* BAs: microbe-derived BAs excluding UDCA. The solid line in (i) represents a smoothed trend line generated using the loess method. The shaded region surrounding the line indicatesa 95% confidence interval.
