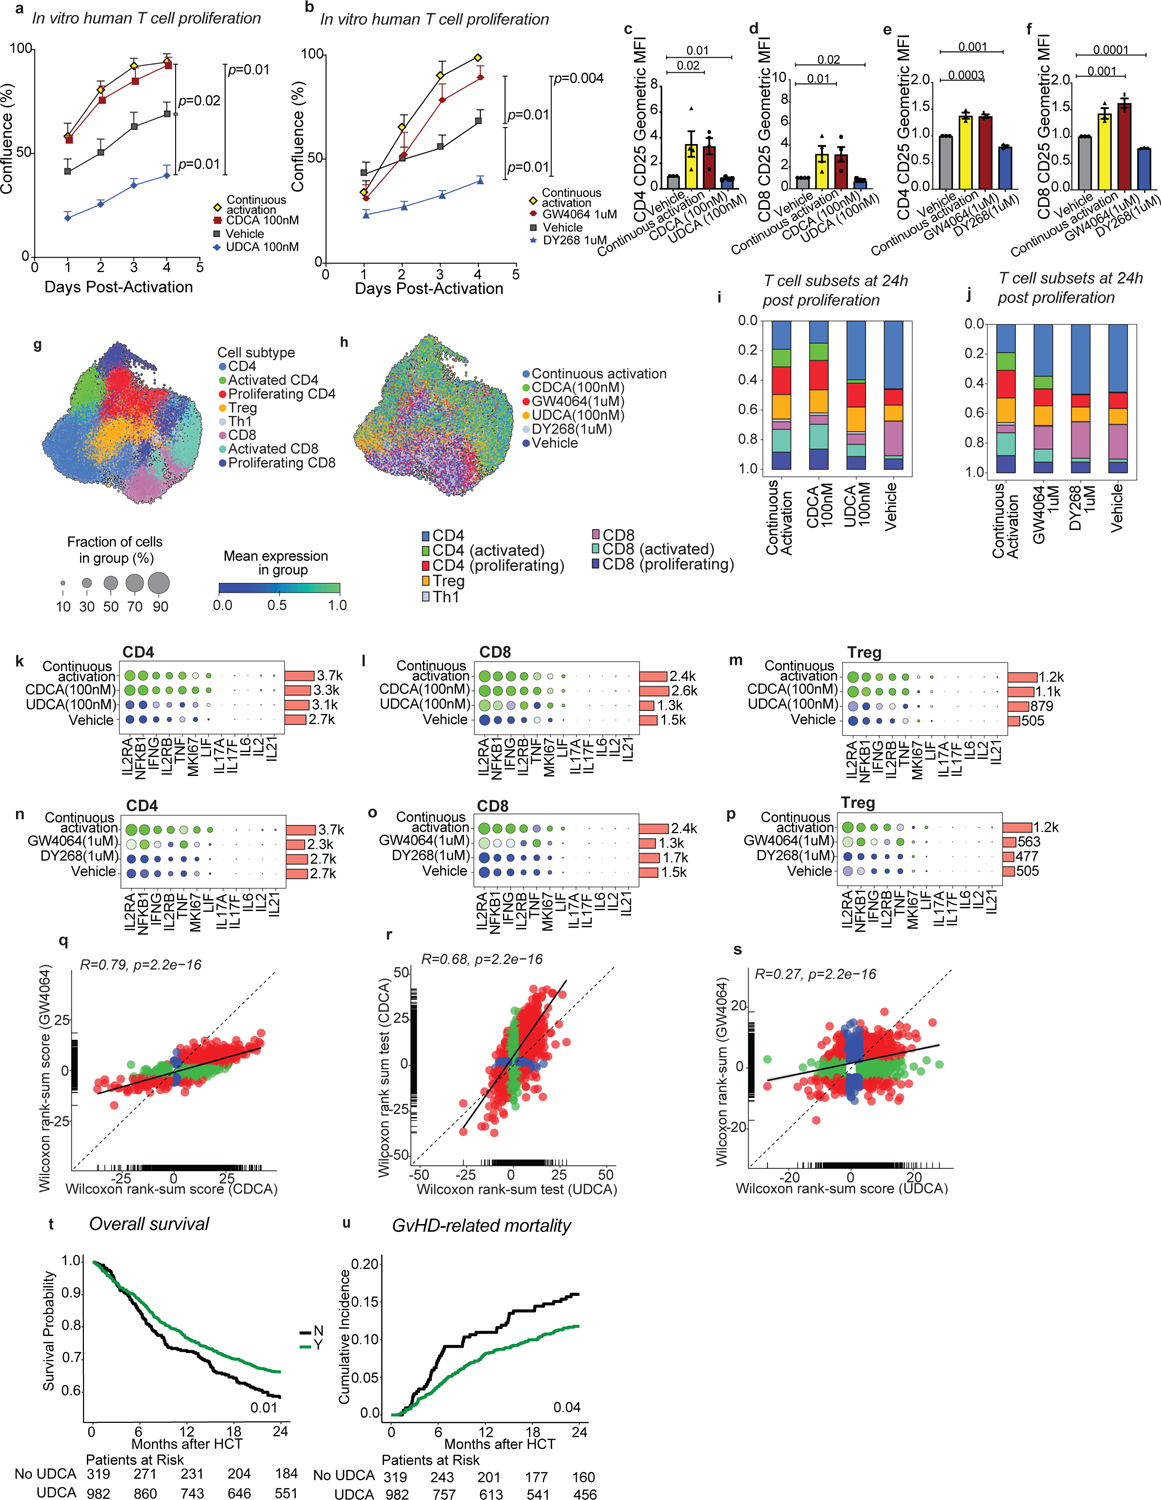
Fig. 6. UDCA limits human effector T cell responses and is associated with improved GVHD-related mortality.

(a-s) Human T cells were activated and further cultured either in the presence of anti-CD3/anti-CD28 (continuous activation control) or in their absence (vehicle control) with or without the indicated compounds for 96 hours. T cell confluence in response to CDCA and UDCA (a) or GW4064 and DY268 after 96 hours (b). CD25 expression of CD4+ and CD8+ T cells after 96 hours of treatment with CDCA and UDCA (c-d), or GW4064 and DY268 (e-f). CD25 expression was measured as geometric mean fluorescence intensity (MFI) of CD25 in CD25+ T cells normalized to the MFI of the vehicle-treated group. (g-s) Single cell RNA-sequencing profiling of activated T cells after 24 hours of treatment with CDCA, UDCA, GW4064 or DY268. Uniform Manifold Approximation and Projection (UMAPs) showing the distribution of the major T cell populations (g) according to treatment group (h). Relative abundances of various T cell clusters in CDCA and UDCA (i), or GW4064 and DY268 (j) treated samples compared to the continuous activation and vehicle. Relative gene expression of selected immune-related genes in CD4 (k,n), CD8 (l,o) and regulatory (m,p) T cells in response to BAs (k-m) and selective FXR ligands. (n-p) Fold-change (FC) vs FC plots comparing the gene expression changes elicited by (q) CDCA and GW4064, (r) CDCA and UDCA, and (s) GW4064 and UDCA relative to vehicle in CD4 T cells. Overall survival (t) and cumulative incidence of GVHD-related mortality (u) in patients who did (n=982) or did not (n=319) receive UDCA. Statistical analysis was performed by two-way (a,b) or one-way ANOVA followed by multiple t-test with Bonferoni correction (c-f). Each data point in (a-f) shows the average of technical duplicates for a single donor. Bars denote the standard error of the mean. Data representative of 4 independent experiments with a total of 4 PBMC donors (a,c,d) or 3 independent experiments with a total of 3 PBMC donors (b,e,f). (g-s) Data from 1 experiment including 2 PBMC donors. (q-s) Statistical analysis was conducted using a 2-sided Wilcoxon rank sum test, with correction for multiple hypotheses using the False Discovery Rate (FDR) method. Outcome analysis was conducted using a log-rank test (t) and the Gray’s test (u).
