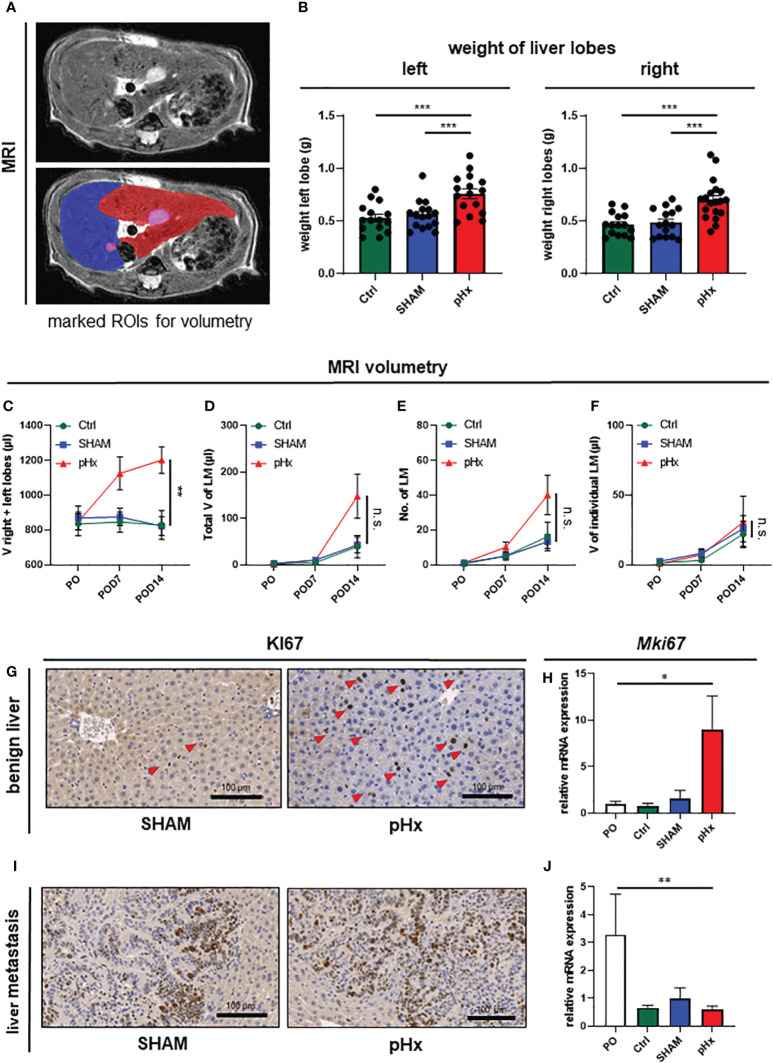
Figure 2.
Medial lobe hepatectomy induces hypertrophy of the residual liver and increases overall metastatic volume and number without affecting the individual growth of each metastasis. (A) Representative MRI of liver and LM following pHx (POD7) in native T2-weighted MRI (top) and with marked regions of interest (ROI) (bottom): blue: right upper hepatic lobe, red: left hepatic lobe, pink: LM; (B) Boxplots showing the weight in grams of left and right liver lobes after euthanasia of Ctrl group (n=15/15), SHAM group (n=16/15) and pHx group (n=16/19); (C) Time course analysis of the combined volume of healthy left and right lobes in µl measured in MRI of Ctrl (n=5), SHAM (n=6) and pHx (n=9) group; (D) Time course analysis of total volume of liver metastases in left and right lobes in µl measured in MRI for Ctrl (n=7), SHAM (n=15) and pHx (n=19) group; (E) Time course analysis of the number of LM in left and right lobes assessed in MRI for Ctrl (n=7)), SHAM (n=14) and pHx (n=15) group; (F) Time course analysis of the individual growth in volume of LM in MRI for Ctrl (n=7), SHAM (n=14) and pHx (n=12) group; (G) Representative immunohistochemistry of Ki67 of healthy liver following SHAM- and pHx-surgery. Nuclear counterstaining was performed with hematoxylin, red arrows point to Ki67+ cells; (H) Boxplot representing the relative expression of MKi67 in healthy liver tissue analyzed by qPCR in PO (n=14), Ctrl (n=4), SHAM (n=10) and pHx (n=12) group; (I) Immunohistochemistry of Ki67 of liver metastasis. Nuclear counterstaining was performed with hematoxylin; (J) Boxplot representing the relative expression of Mki67 in liver metastasis analyzed by qPCR for PO (n=5), Ctrl (n=3), SHAM (n=8) and pHx (n=14) group. (Scale bars = 100 µm, bar plots represent mean ± standard error of the mean (SEM), p-values calculated via one-way ANOVA Tukey test, * = p<0.05, **, p <= 0.01 *** = p<0.001).

