Figure 3.
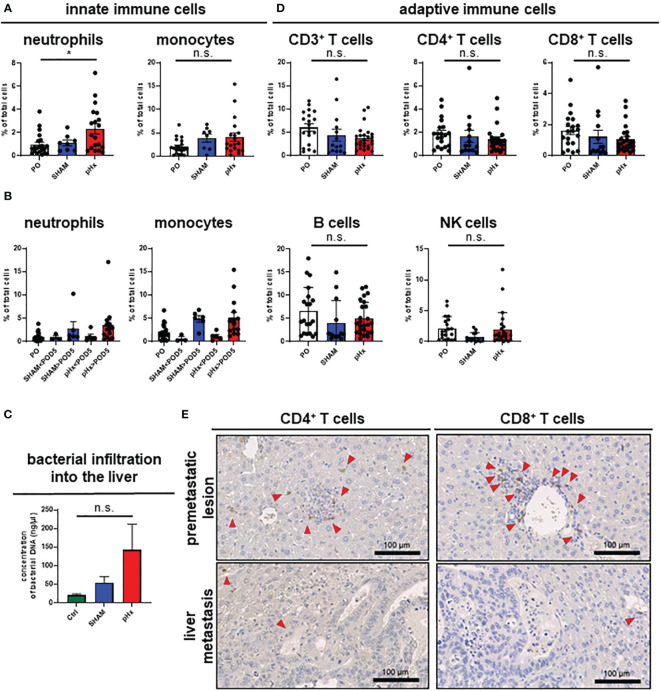
pHx induces neutrophil accumulation and increases bacterial abundance in the residual liver. (A) Flow cytometric analysis with staining of different populations of innate immune cells in healthy liver tissue (neutrophils: CD45+/CD11b+/Ly6G+/CD64-, monocytes: CD45+/CD11b+/Ly6G-/CD64+) for PO (n=21), SHAM (n=8) and pHx (n=19) group, (B) Time course of infiltration of the liver with innate immune cells before POD5 (range POD3–5) and after POD5 (range POD7–14) for PO (n=21), SHAM<POD5 (n=3), SHAM>POD5 (n=6), pHx<POD5 (n=5) and pHx>POD5 (n=14) group; (C) Concentration (ng/µl) of bacterial DNA in healthy liver measured with qPCR for Ctrl (n=5), SHAM (n=5) and pHx (n=7) group; (D) FACS analysis of different populations of adaptive immune cells in healthy liver tissue following pHx (NK cells: CD45+/CD3-/NK1.1+, T cells: CD45+/CD3+/NK1.1-, B cells: CD45+/CD3-/B220+) for PO (n=20), SHAM (n=14) and pHx (n=25) group; (E) Representative immunohistochemistry of the distribution of CD4+ and CD8+ T cells in healthy liver and accumulation in premetastatic lesions (top) with absence in macroscopic metastasis (bottom). Red arrows point to the cells of interest. (Scale bars = 100 µm, bar plots represent mean ± SEM). n.s. non significant.

