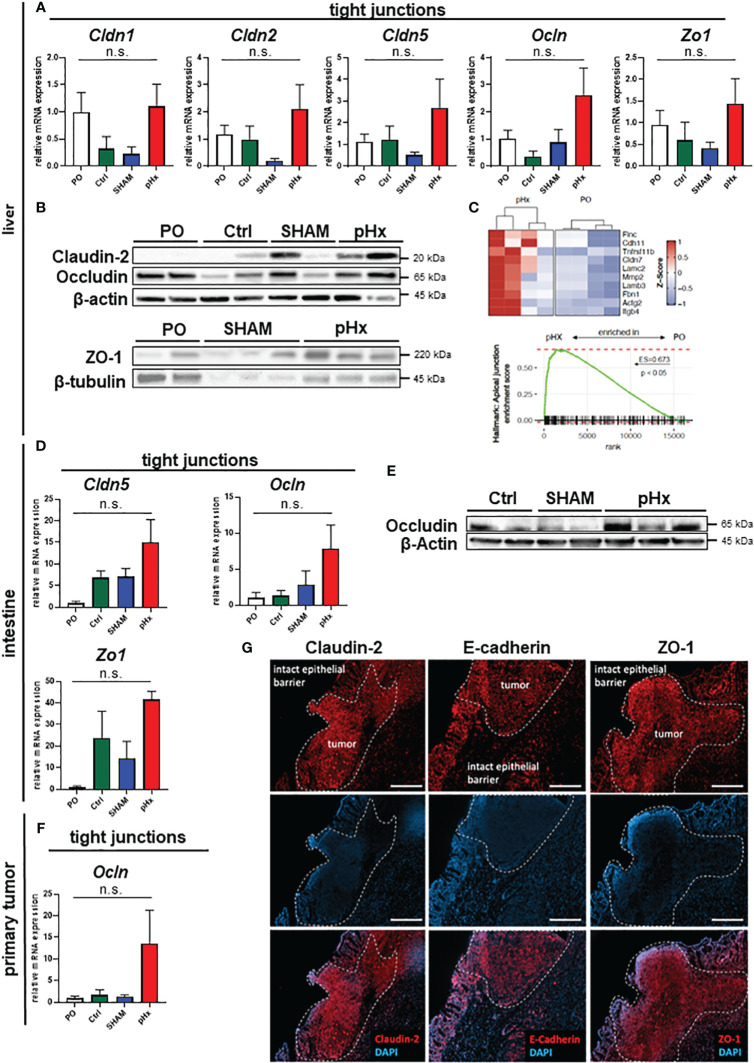
Figure 6.
pHx induces tight junction formation in the liver which may impact tumor cell seeding. (A) Relative expression of tight junction (TJ) genes Cldn1, Cldn2, Cldn5, Ocln and Zo1 in healthy liver analyzed with qPCR for PO (n=17), Ctrl (n=4), SHAM (n=12) and pHx (n=20) groups; (B) Western Blot of selected tight junction proteins Claudin2, Occludin and ZO-1 in the liver. β-actin and β-tubulin were used as loading control; (C) Gene Set Enrichment Analysis of bulk RNA sequencing from healthy livers for the hallmark apical junction with heatmap of the 10 leading genes involved according to Z-scores; (D) Relative gene expression of Cldn5, Ocln and Zo1 in healthy cecum analyzed with qPCR for PO (n=4), Ctrl (n=4), SHAM (n=4) and pHx (n=6) groups; (E) Representative Western Blot analysis of protein expression of Occludin in the cecum. β-actin was used as loading control; (F) Relative expression of Ocln in primary tumors analyzed with qPCR for PO (n=9), Ctrl (n=4), SHAM (n=7) and pHx (n=17) groups; (G) Immunofluorescence stainings of tight junction proteins (Claudin-2, E-cadherin, and ZO-1) in healthy epithelium and primary CRC (scale bar = 100 µm). Counterstaining of the nuclei was performed with DAPI. The white dashed lines mark the border between intact and benign epithelial cells and the primary tumors. (Bar plots represent mean ± SEM, n.s. non significant).

