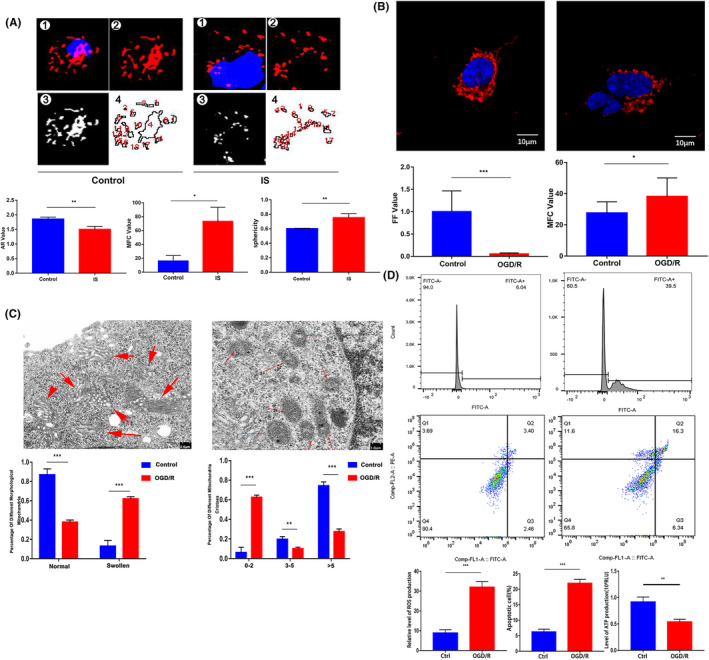
FIGURE 1.

Changes of mitochondrial dynamics and function in clinical samples and OGD models (*p < 0.05, **p < 0.01, ***p < 0.001). (A) The mitochondrial morphology of PBMCs was compared between IS group and control group with LSCM (Mitotracker Red was used for mitochondrial staining).(B) Comparison of mitochondrial morphology between control group and OGD/R group (Mitotracker Red was used for mitochondrial staining). (C) The changes of mitochondrial ultrastructure after OGD/R treatment were observed by electron microscopy. (D) After OGD/R, flow cytometry was used to detect the level of ROS and apoptosis, ATP detection with Microplate Luminometer.
