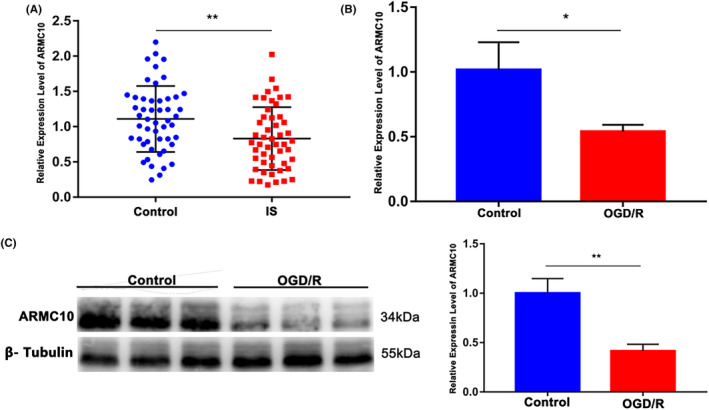
FIGURE 2.

Exploring genes that regulate mitochondrial dynamics changes. (*p < 0.05, **p < 0.01, ***p < 0.001). (A) RT‐qPCR detect the expression of ARMC10 in peripheral blood of the control group and the IS group. (B) RT‐qPCR detect ARMC10 expression levels of SH‐SY5Y in control group and OGD/R group. (C) ARMC10 expression levels of SH‐SY5Y in ODG/R group and control group.
