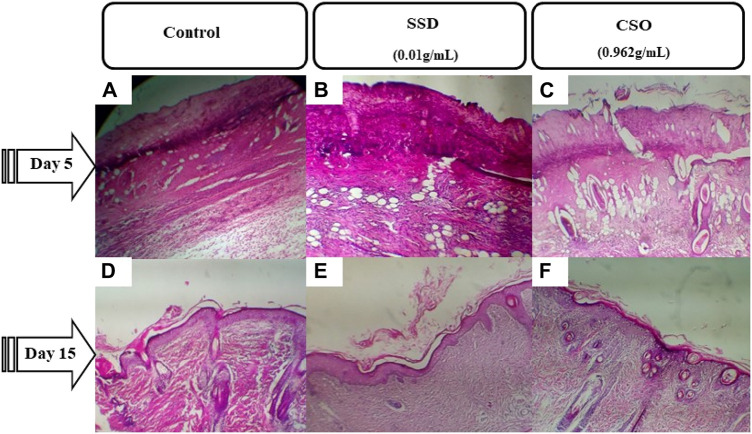
FIGURE 3.
Photomicrographs of burned skin sections 5 days and 15 days after burns and various treatments. (A) untreated negative control on day 5, (B) group treated with SSD on day 5, and (C) group treated with CSO on day 5. (D) Untreated negative control group on day 15, (E) group treated with SSD on day 15, and (F) group treated with CSO on day 15. Images are acquired at a magnification of 100×.

